---
title: self service analytics start.io mobile data for retail analysis
description: Register for xyzt.ai's webinar with start.io to learn how mobile data and self-service visual analytics can help the retail industry recover from Covid-19
---
[](https://www.xyzt.ai)
WEBINAR ON DEMAND
# Skip the Line
Self-Service Analytics Using Mobile Data for Retail
WEBINAR OVERVIEW
### The Retail Industry is Changing
Brick-and-mortar stores have been suffering. Add the effects of Covid-19 and changes in buying habits, the retail industry in our cities faces a very bleak future. What can the industry do to fight back?
Learn how retailers, data providers, and analysts can use alternative big data sources such as mobile data and self-service visual analytics technology to make better strategic business decisions and recover from the effects of the pandemic.
Bart Adams, xyzt.ai's CTO, tells you more.

MEET THE EXPERTS

### Bart Adams
Co-Founder & CTO, [xyzt.ai](http://www.xyzt.ai)
-

### Gal Benshlomo
Data Science Team Lead, [start.io](https://www.start.io/)
-
TESTIMONIAL
Our partnership with xyzt.ai provides our customers with an easy and simple tool to access our data platform and better understand their audience. The xyzt.ai visual analytics platform handles our data even for large and real-time data sizes.

Gil Dudkiewicz
CEO, start.io
REGISTER TO WATCH
# Extract More and Smarter Insights From Mobile Data
Mobile data is a non-traditional alternative data source that yields additional insights that complement the information you receive from traditional sources.
Foot traffic is an alternative data source that is derived from mobile data and can transform a business. It has many uses, from hedge funds and analyzing the flow of commodities around the globe to predicting geopolitical risk and knowing where to open a new retail business in metropolitan centers.
However, working with mobile data and performing analysis on it can be a real challenge. Analysts and data companies alike have real difficulties analyzing data that is both spatial and temporal for the following reasons:
1. The data is big data.
2. The data has multiple properties. It's multi-signal and not just location; it's much more.
3. The data is Spatio-temporal and cannot be handled very well using traditional geospatial software of business intelligence tools.
Register now and join xyzt.ai's CTO [Bart Adams](https://www.linkedin.com/in/barta/), and start.io's Data Science Team Lead, Gal Benshlomo, to learn how retailers, data providers, and analysts can use mobile data and self-service visual analytics technology to make better strategic business decisions and recover from the effects of the pandemic.
Scroll down to learn more about the use cases demonstrated in the webinar.
## Deep Dive into Mobile Data for Retail
- [Use Case One](https://info.xyzt.ai/self-service-analytics-start.io-mobile-data-for-retail-analysis#item1-widget_1634808185570)
- [Use Case Two](https://info.xyzt.ai/self-service-analytics-start.io-mobile-data-for-retail-analysis#item2-widget_1634808185570)
- [Use Case Three](https://info.xyzt.ai/self-service-analytics-start.io-mobile-data-for-retail-analysis#item3-widget_1634808185570)
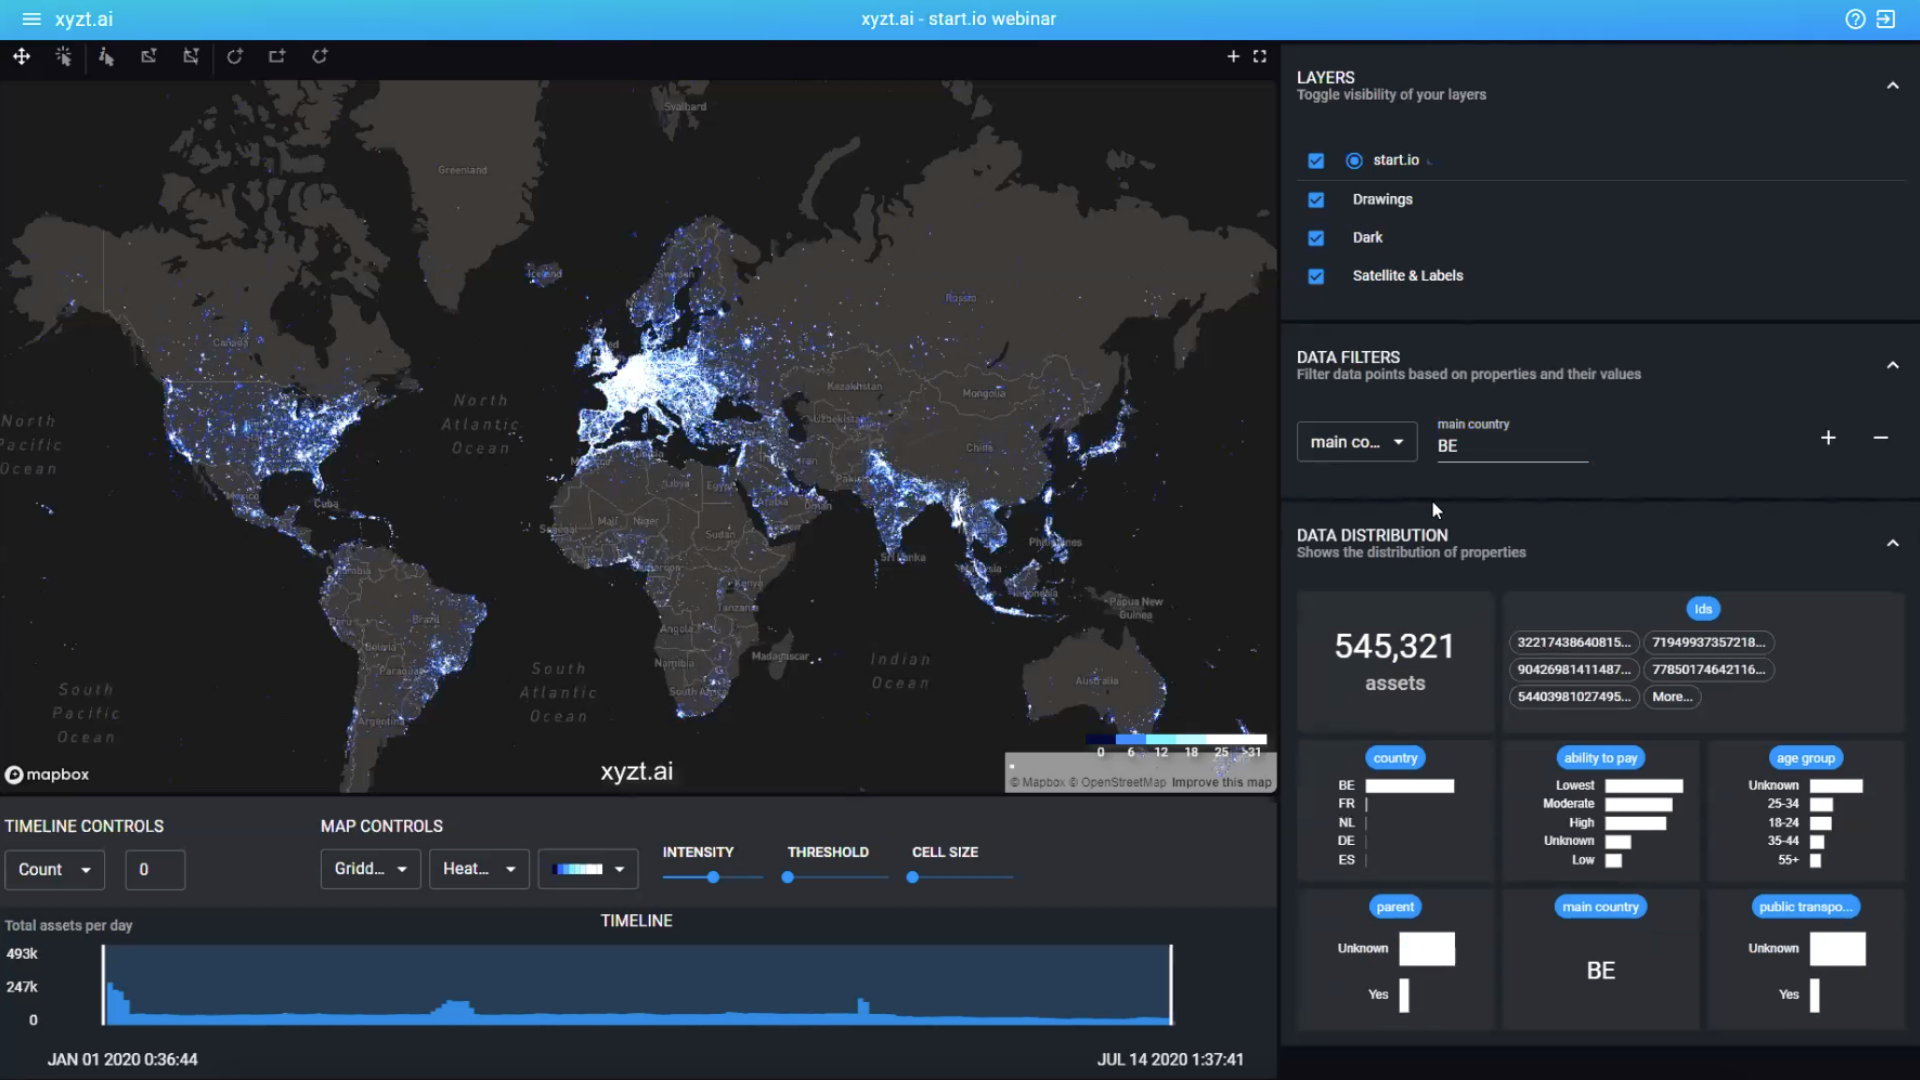
## Global Data Visualized
Where do people come from? Where do they go? What age are they? Find out by visualizing billions of data points, uncover trends over time, and interrogate data attributes.
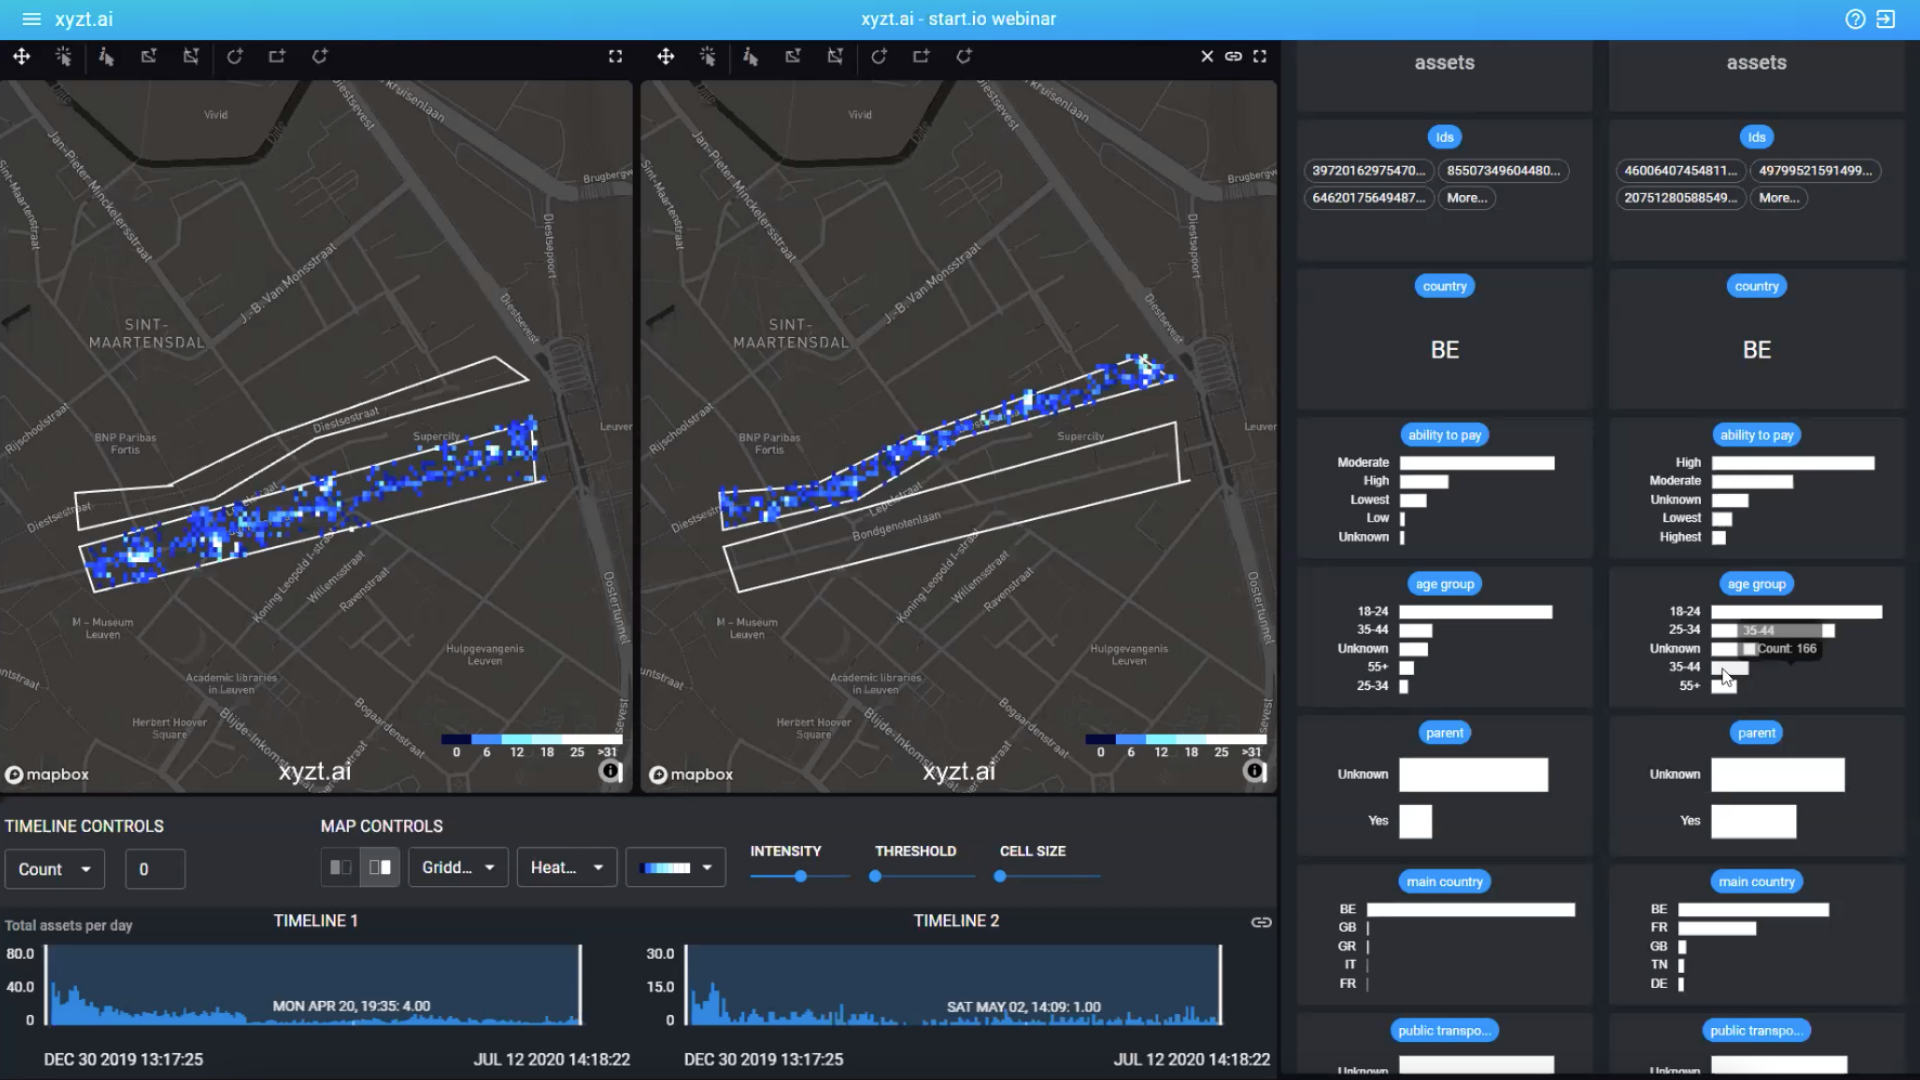
## Analyze and Compare Footfall
How has Covid-19 affected shopping habits in our cities? Discover through split-view analysis the changes in footfall and demographics.
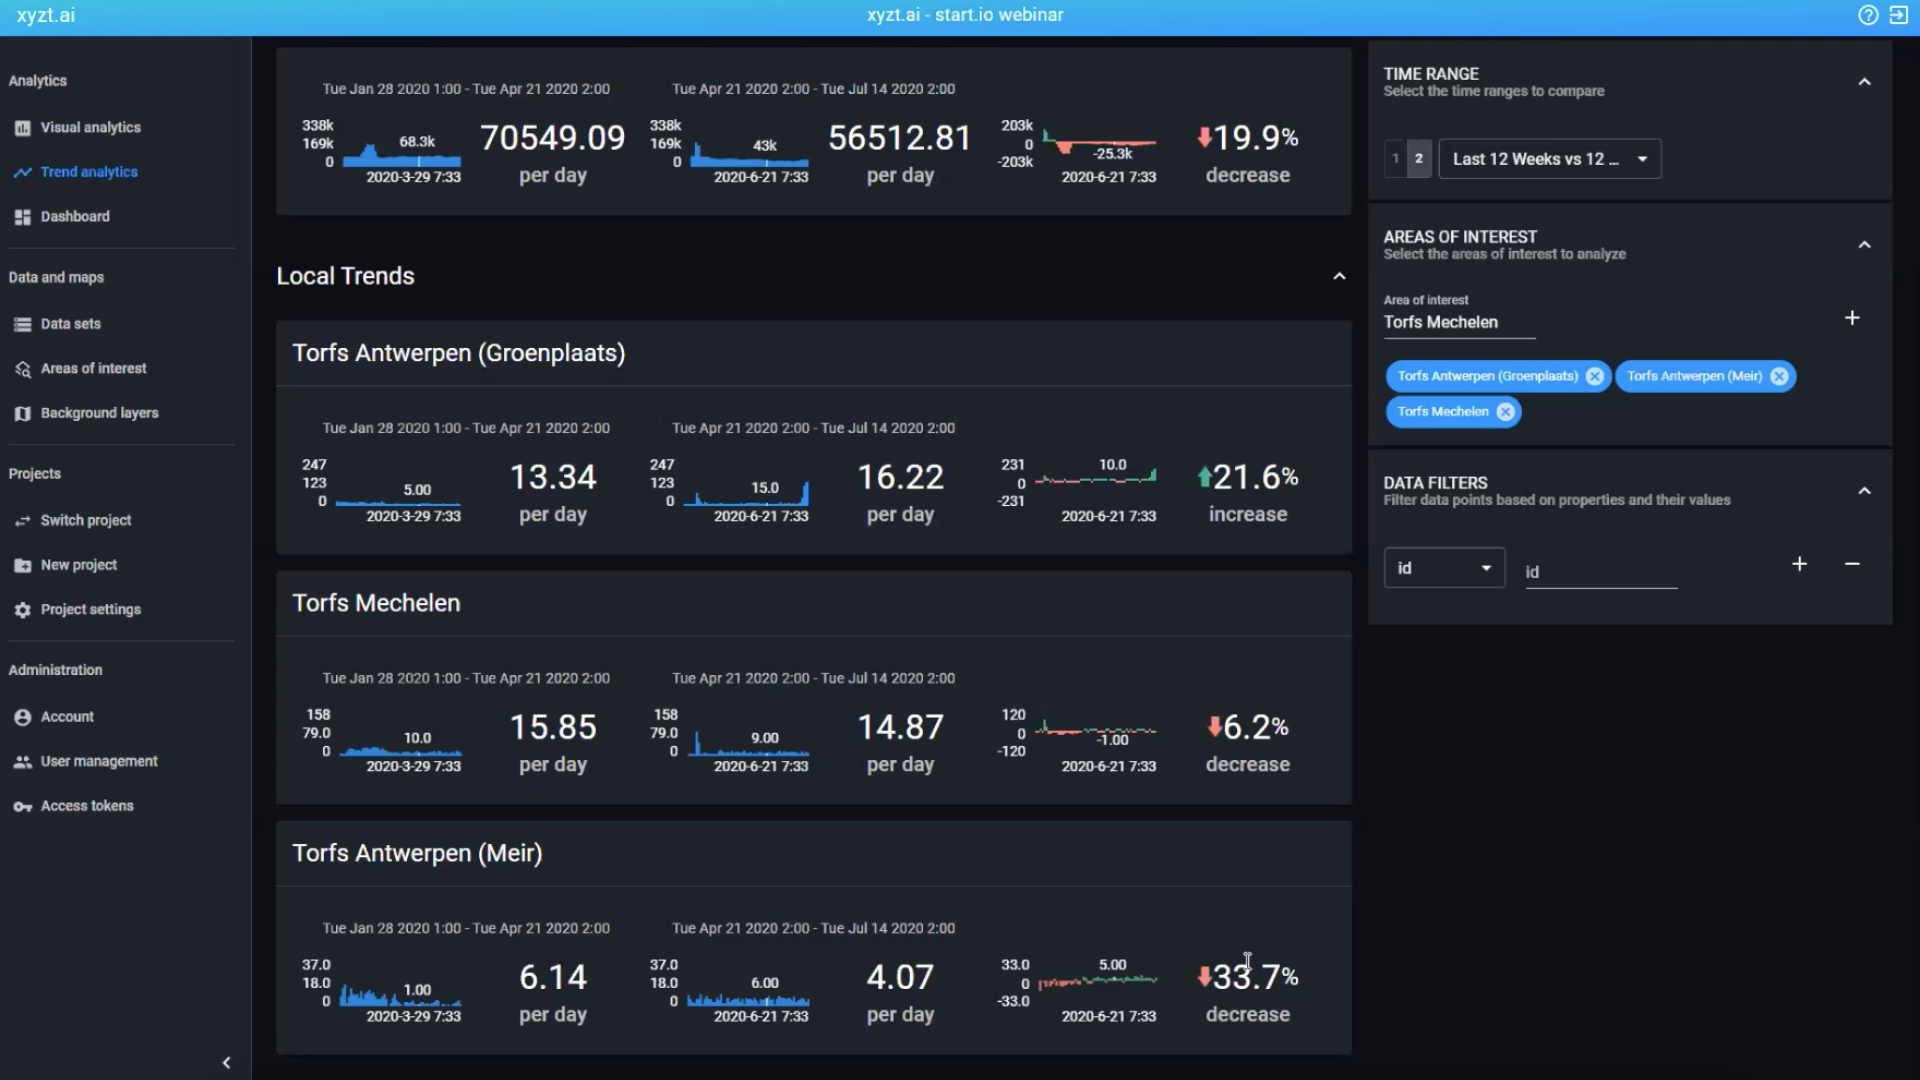
## Analyze Areas of Interest
Analyze store locations and the effects of Covid-19. Compare locations over time and identify changes in footfall.
## See xyzt.ai in action
Our self-service analytics platform enables analysts to extract and share insights from any data source.
If you want to learn more about how xyzt.ai can help you and your organization, please schedule a live demo with one of our experts.
During the demo, we can discuss your requirements, answer any questions you may have, and review how our platform can benefit you.
[Request a demo](https://xyzt.ai/pages/request-a-free-demo)
Copyright © 2026 xyzt.ai. All rights reserved.
```json
{
"@context" : "https://schema.org",
"@type" : "VideoObject",
"caption" : {
"@type" : "MediaObject",
"contentUrl" : "https://info.xyzt.ai/media-transcripts/59752078747/en.vtt",
"inLanguage" : "en",
"name" : "en Captions"
},
"contentUrl" : "https://7617604.fs1.hubspotusercontent-na1.net/hubfs/7617604/Start.io%20webinar%20teaser%202.mp4",
"dateModified" : "2026-05-18T12:43:32.342Z",
"description" : "",
"duration" : "PT1M14.235S",
"height" : 2160,
"name" : "Start.io webinar teaser 2",
"thumbnailUrl" : "https://7617604.fs1.hubspotusercontent-na1.net/hubfs/7617604/Start.io%20webinar%20teaser%202.mp4/medium.jpg",
"uploadDate" : "2021-11-15T13:16:38.252Z",
"width" : 3840
}
```