User Benefits Overview
Discover xyzt.ai's platform features to turn your data into actionable insights

Travel Time Analytics
The Travel Time Analytics feature enables you to analyze journey durations by deriving travel time as a property in movement data sets.
It simplifies the analysis of metrics like average, minimum, and maximum travel times while uncovering trends, changes, and distributions.
This empowers better decision-making, optimizes operations, and helps identify inefficiencies quickly.
.png?width=1200&name=Image%20-%20%20News%20Section%20%20(1200%20x%20627%20px).png)
just ask xyzt.ai™ - GenAi for Space-Time Analytics
This feature leverages generative AI to simplify space-time analytics, enabling you to extract insights and create interactive dashboards using natural language.
Save time with instant query and dashboard creation while maintaining enhanced privacy through secure, on-premises deployment.
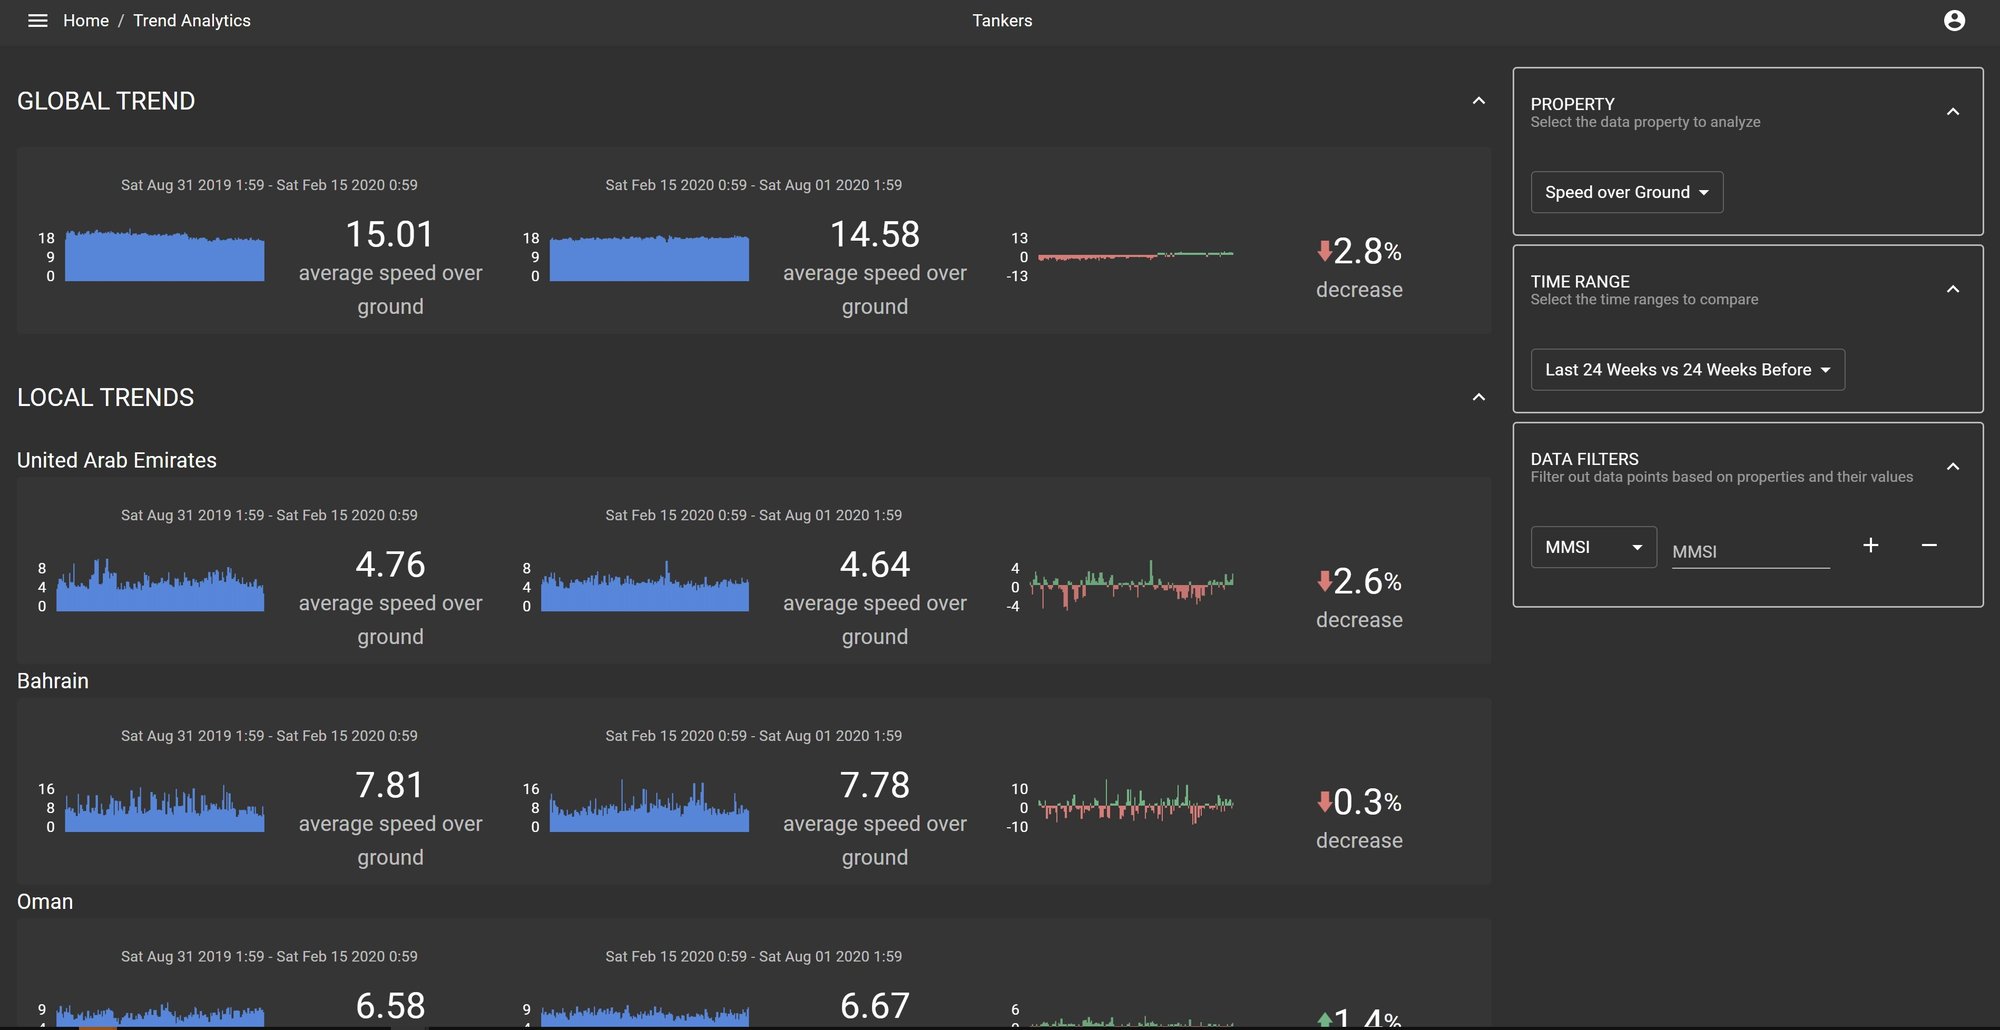
Trend Analytics
Trend Analytics helps you track global and local changes in your data over time.
With spatial, temporal, and attribute filters, it provides a clear understanding of how activity develops, making it easy to monitor trends effectively.

Support for Parquet File Format
Users can now upload Parquet files directly, streamlining workflows and eliminating the need for file conversions.
This enhancement improves efficiency for those working with modern data pipelines and large datasets.
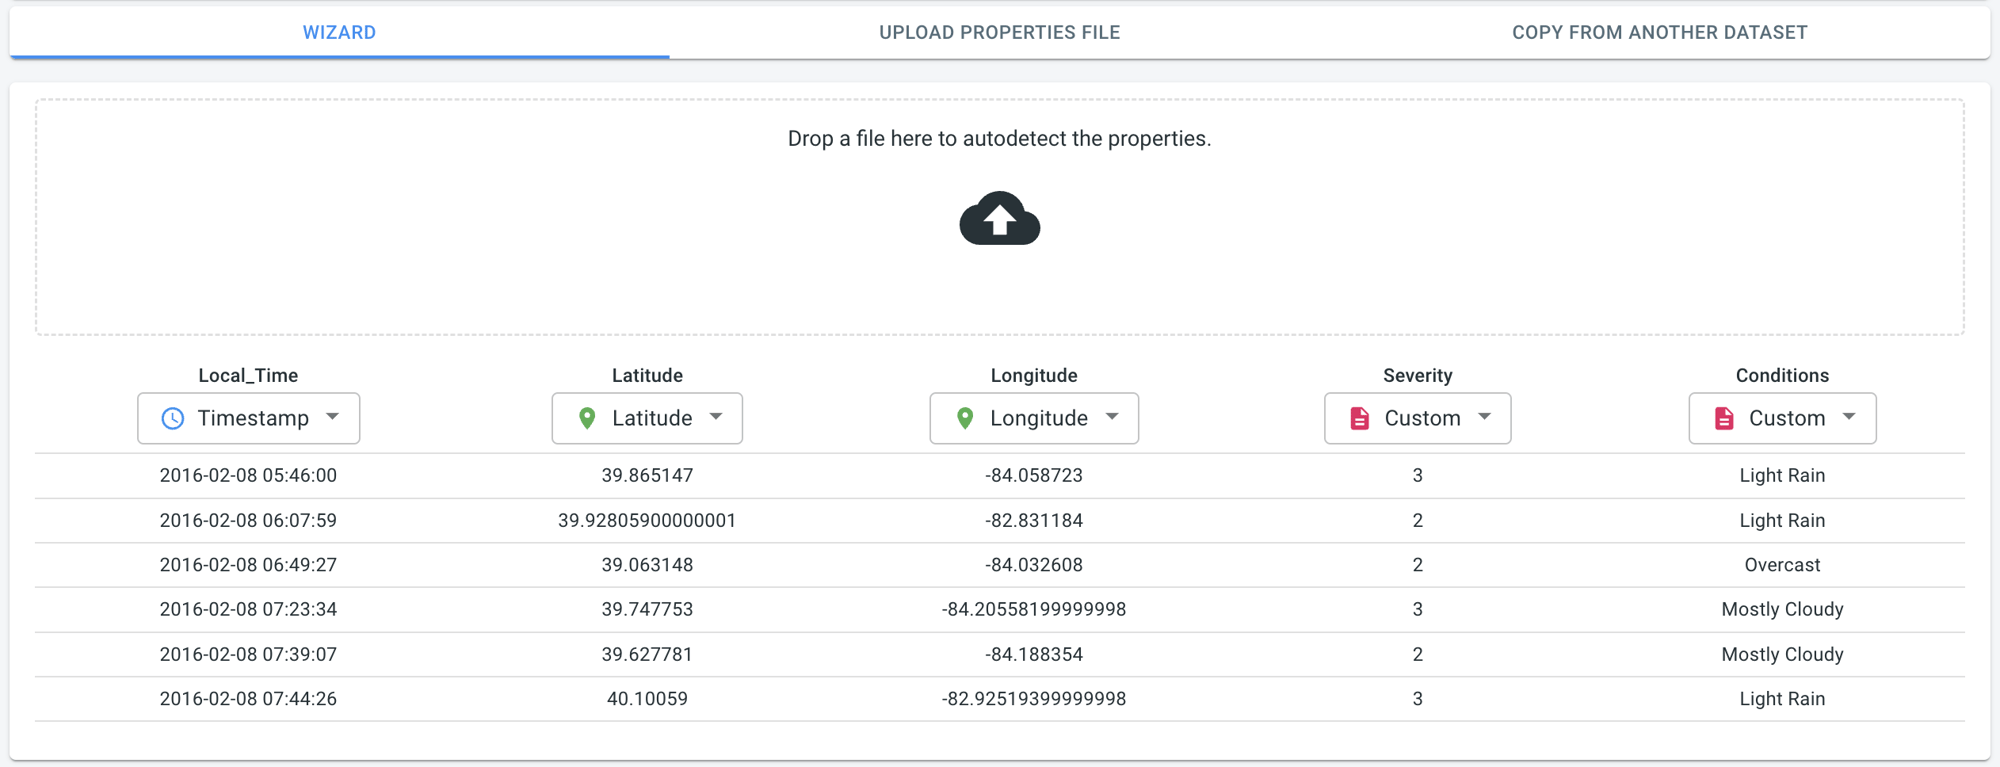
Improved Data Upload Wizard
The updated wizard allows you to upload a sample file during schema definition, offering a data preview and simplified column selection for CSV, GeoJSON, and Parquet files.
You can also copy schema definitions from existing datasets, upload pre-defined schemas, or use the wizard as before.
.png?width=2000&height=1045&name=xyzt.ai_road_accidents%20(1).png)
Dedicated Point Data Handling
The new "Point Data" dataset type is optimized for discrete locations, such as accident sites or specific events, without requiring asset IDs.
This eliminates the limitations of treating independent locations as movement data.

Enhanced Advanced Filter Editor
Write spatiotemporal filters more efficiently with features like syntax highlighting, error detection, auto-completion, and embedded documentation.
This ensures faster, error-free filtering with easy access to relevant guidance.
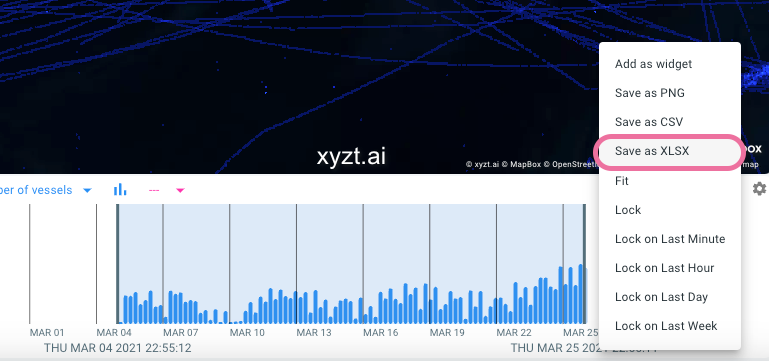
Download Chart Data as Excel Files
Export chart data directly as .xlsx files to save time and avoid common CSV compatibility issues.
This ensures accurate representation in Excel and simplifies data handling.
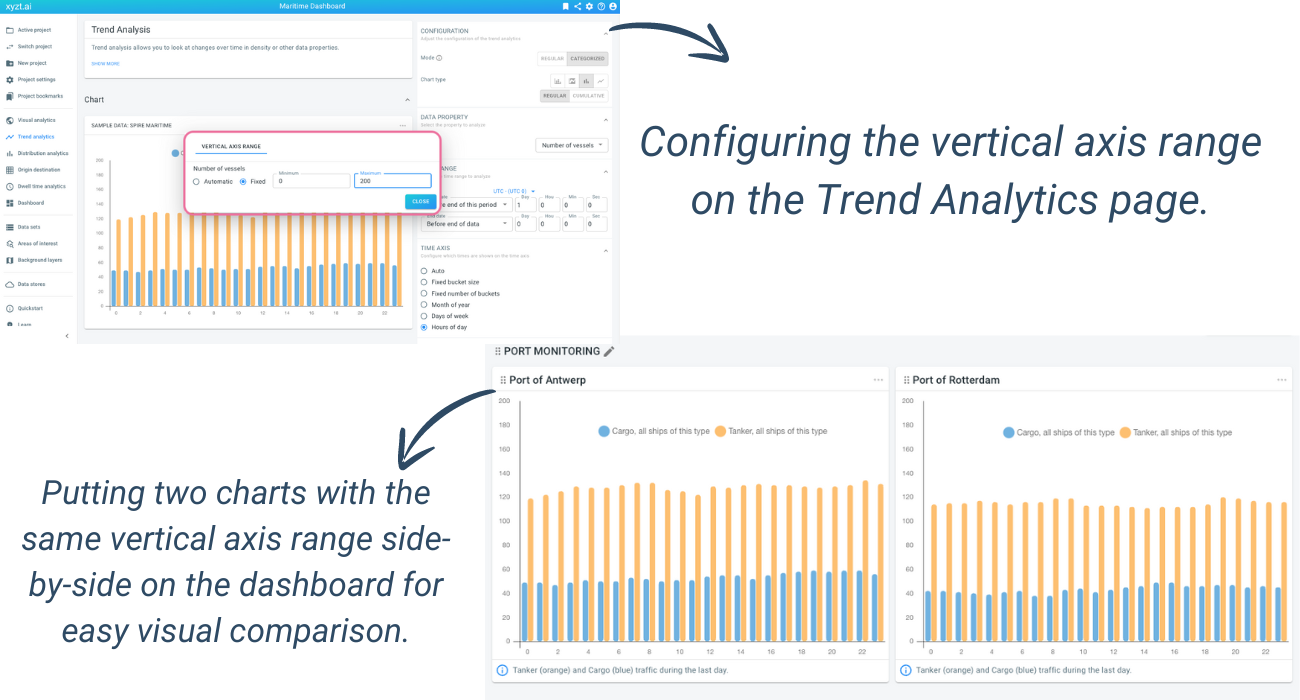
Fixed Vertical Axis Range for Charts
Set consistent vertical axis ranges for better trend comparison across charts.
While the default behavior remains automatic, this feature enhances clarity for timeline and trend visualizations.
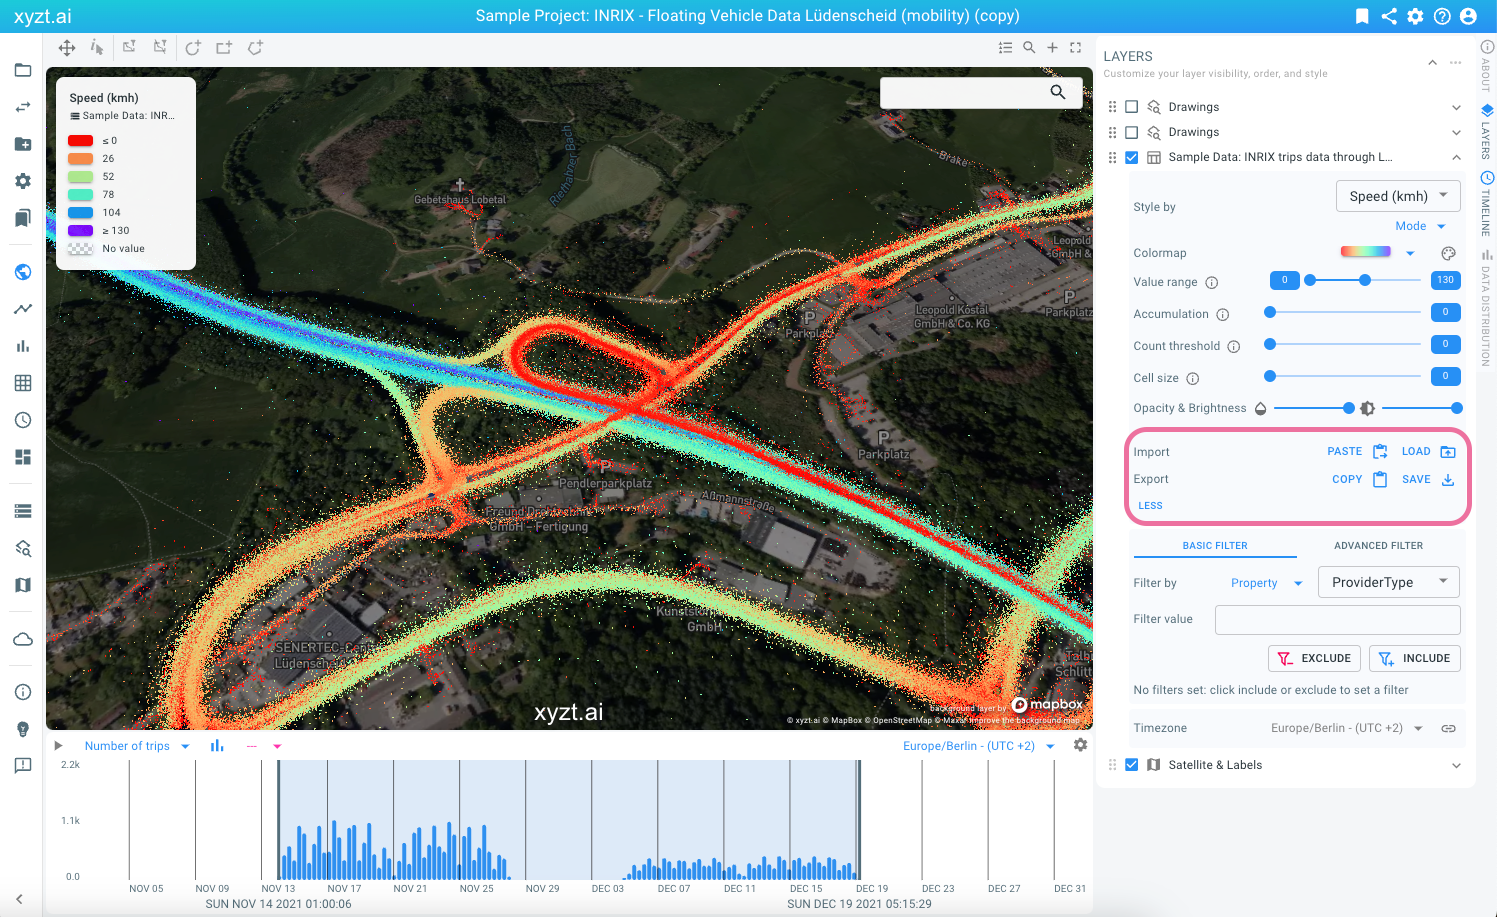
Import, Export, and Copy-Paste Layer Styles
Standardize and reuse layer styles effortlessly across projects by importing, exporting, or copying styles.
This feature streamlines styling workflows and supports automation via API for large-scale projects.
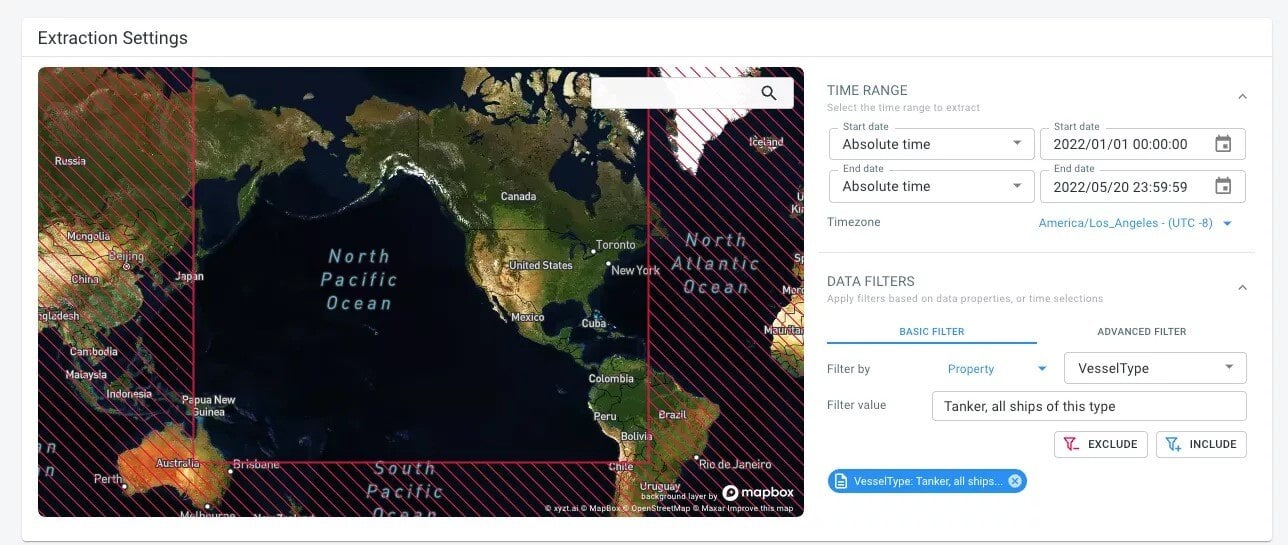
Unlimited Data Stores
Store datasets with hundreds of billions of records using the platform’s proprietary space-time database.
This enables fast, no-code extraction of subsets for traffic and maritime analytics, such as analyzing floating vehicle data or vessel tracking data for detailed insights.

Advanced Space Time Query Language
This powerful query language is designed for seamless analysis of spatio-temporal data, enabling real-time filtering and visualization of movement flows.
Its adaptability makes it ideal for dynamic scenarios like traffic deviations, road works, and construction, offering immediate insights.
Thanks to the xyzt.ai platform, we've gained unparalleled insight into traffic dynamics across North-Rhine Westphalia.
With its intuitive traffic flow filters and dynamic visualizations, we can effortlessly grasp the effects of various traffic management strategies, applied for example during major road closures. This innovative no-code analytics solution stands out in its ability to handle complex mobility data, including big floating vehicle data, empowering us to make informed decisions with ease.”
Road efficiency and safety affect us all. We are in the business to help our customers take reliable data-driven decisions to make roads safer and better. Thanks to xyzt.ai, we can perform our analysis in a much more instant and interactive way, drastically reducing our work effort and more quickly extracting insights and producing reports.
The xyzt.ai solution enables our customers to quickly and easily use INRIX data for traffic-related analysis purposes and to immediately gain important insights for planning purposes without any programming effort. xyzt.ai is the perfect complementary tool to INRIX’s proposition.
“Working with xyzt.ai is such a win-win. We capture real-time series data with our sensors and by using the xyzt.ai analytics tool, we can make the data intuitive for our customers to understand. We can spatially visualize the data, learn about the different segmentations, and we can create data dashboards to combine it with our own. This combination of having a go-to tool that we can use internally as well as externally to show our data to customers is very important for us.”
At Spire, we understand how to collect AIS data from space and develop high-value analytics products. We are proud to support xyzt.ai's explorer tool, which makes it easier to analyze data and visualize the analysis and dynamic on-demand analysis of huge volumes of data.
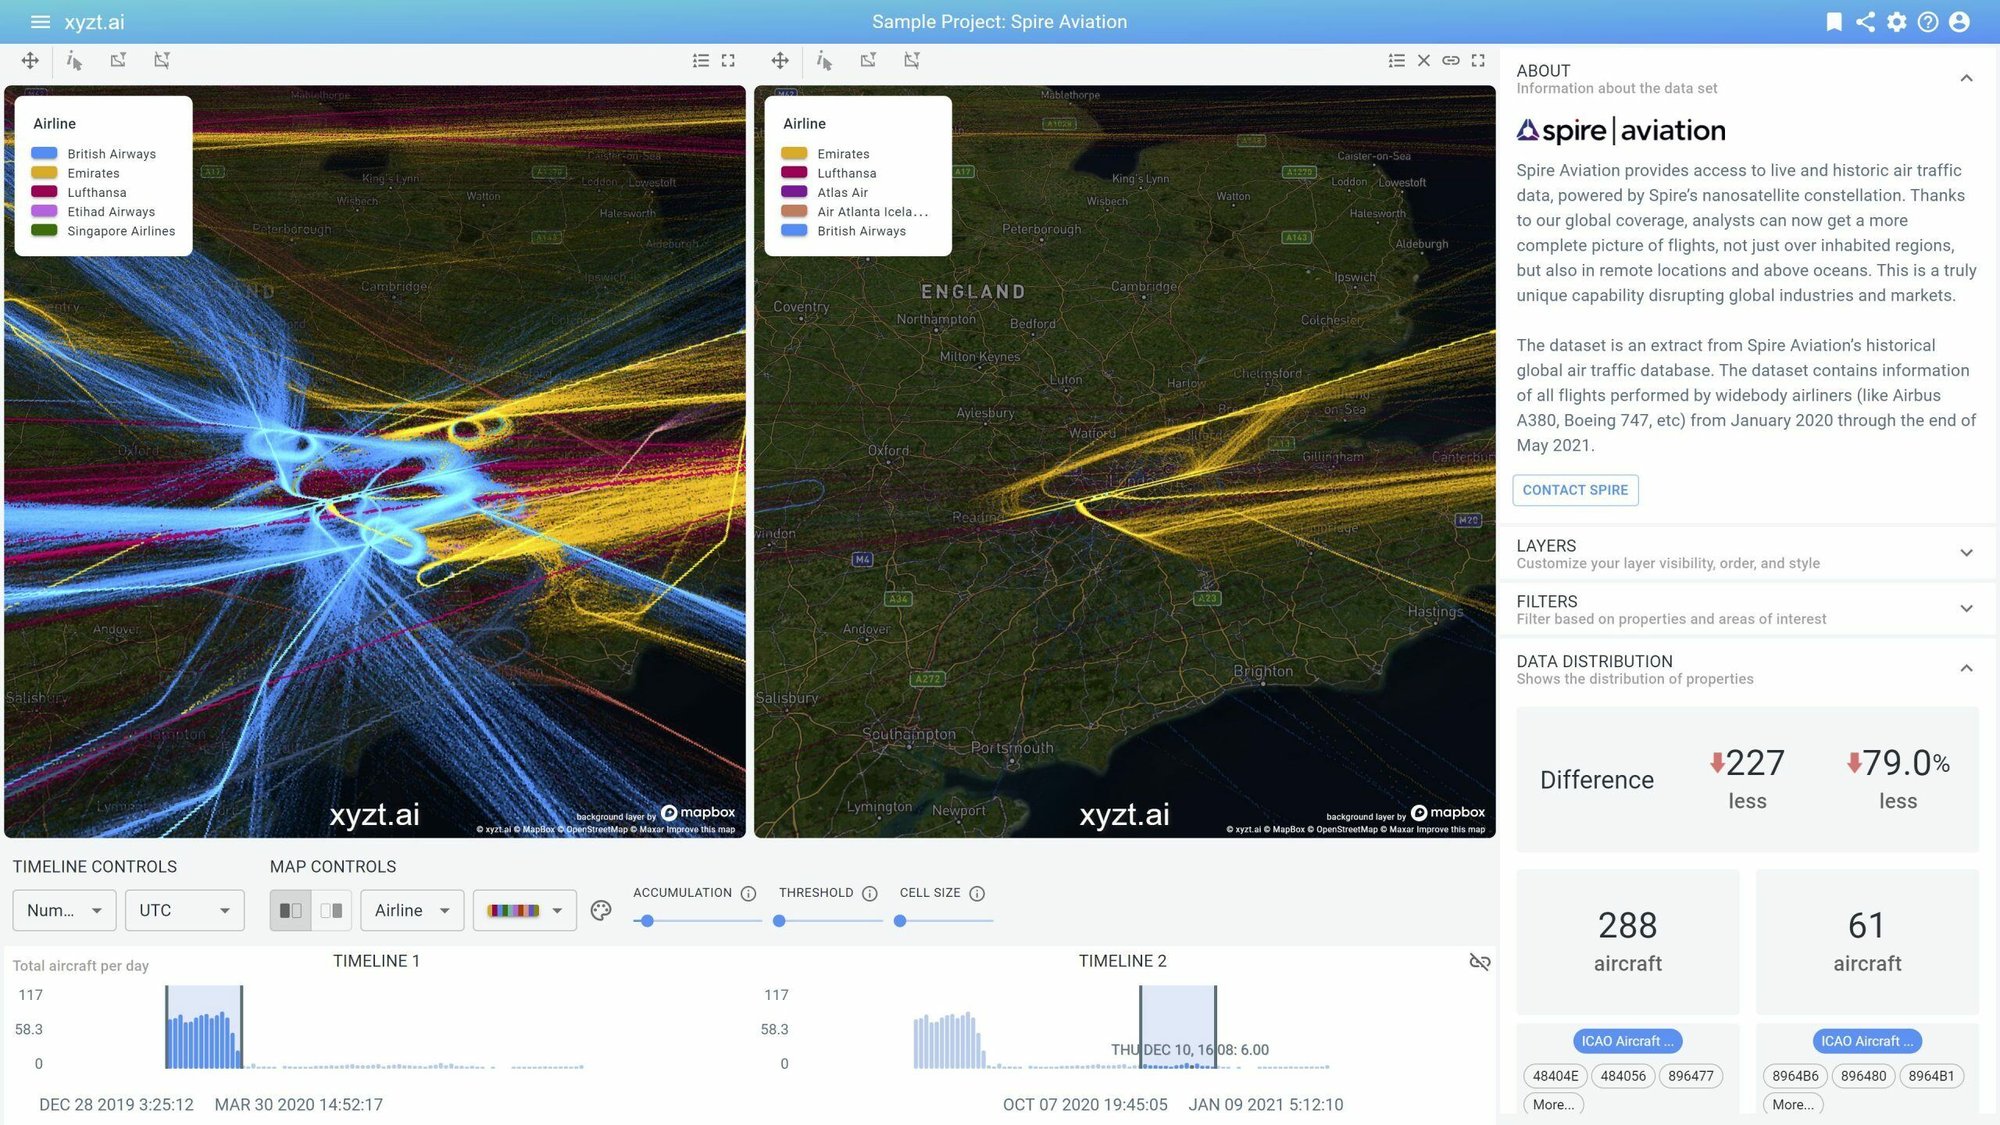
Split-View Analysis
Compare two time periods, regions, or subsets of data side by side using split views, timelines, and widgets.
This is ideal for analyzing changes, comparing performance across locations, or visualizing the same dataset with different styles, such as vessel type vs. navigational status.
.jpg)
Analyze Traffic Flows with Origin, Destination, and Corridor Filters
Easily analyze traffic origins, destinations, and routes by drawing areas on a map as spatial filters.
Corridor analysis lets you examine journeys passing through specific areas at both local (e.g., city traffic) and global (e.g., maritime shipping) scales, leveraging multi-scale data representations for precision.
.jpg?width=2000&height=1035&name=NewFeatures-Pic-PR-scaled%20(1).jpg)
Data-Driven Styling Customized to Your Needs
Present your insights visually with full flexibility in styling.
Define gradients, color maps, and visual properties based on your data to create maps, charts, and dashboards tailored to your storytelling needs.
.jpg?width=2000&height=745&name=origindestination-page-light-scaled%20(1).jpg)
Origin-Destination (OD) Matrices
Analyze traffic flow between multiple areas with a dedicated OD page.
Instantly view origin-destination patterns, pick specific periods, and apply filters to focus on subsets of traffic.
Results can be added to dashboards or shared via links for easy collaboration.
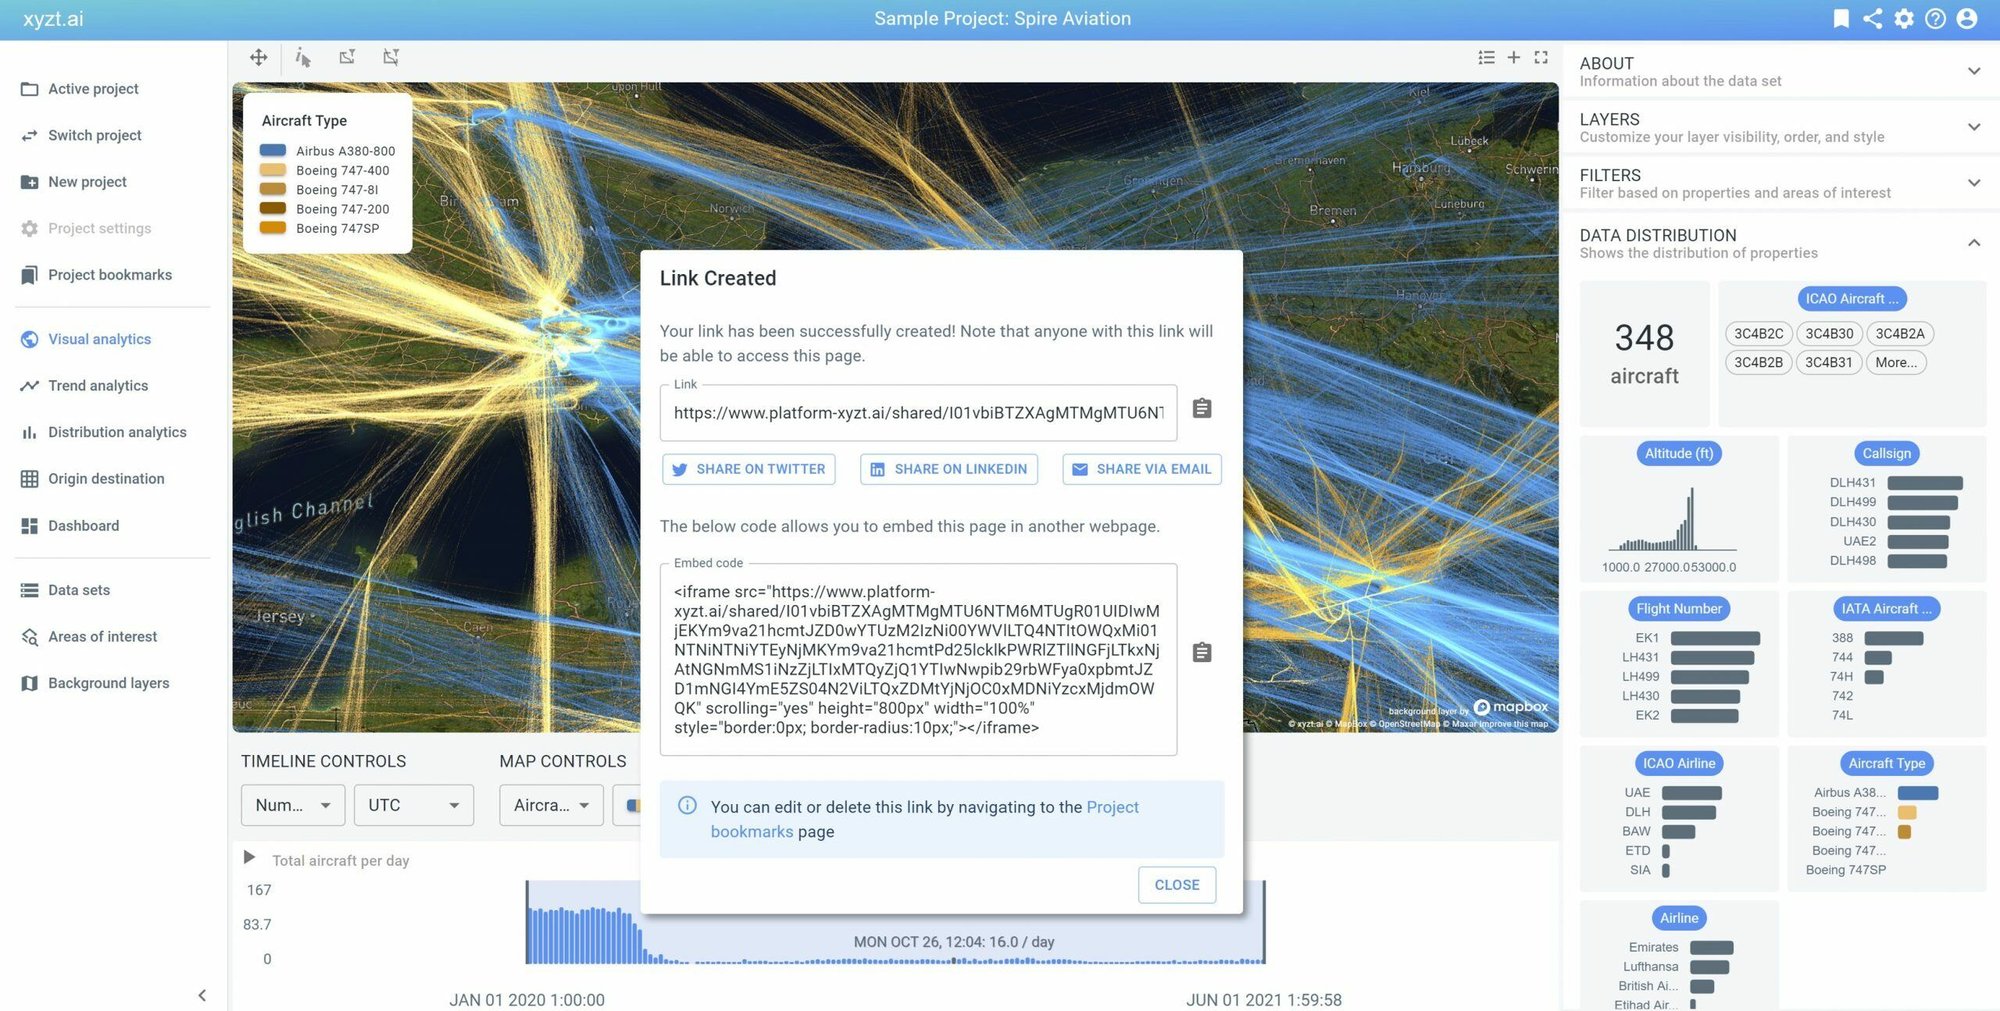
Externally Shareable Insights
Share your analysis with customers, partners, or your audience through interactive, shareable links.
Port authorities can provide vessel movement insights to terminal operators or sea police, while mobility analysts can share traffic findings with policymakers or the press in a visually compelling way.
.jpg?width=2000&height=1123&name=twodistributions%20(1).jpg)
Distribution and Segmentation Analysis
Understand how your data is distributed or segmented with a dedicated analytics page. Easily analyze audience demographics for retail footfall or view draught distributions over time in maritime trading, offering actionable insights for a variety of use cases.
.png?width=1621&name=enhanced-temporal-filtering%20(1).png)
Creative and Precise Temporal Filtering
Enhance your analysis with absolute and relative temporal filters.
Absolute filters let you select specific days and timeslots, while relative filters dynamically adjust to new data, always reporting on the last hour, day, or week.
Use these filters with Split View analysis to compare timelines and uncover meaningful insights.
.png?width=1628&name=instant-value-filters%20(1).png)
Instant Filtering by Key Values
Quickly refine your analysis by visualizing data based on minimum, maximum, average, or mode values.
This feature ensures you can make informed decisions by evaluating numeric properties comprehensively, such as analyzing average or extreme pollution levels over time.
.png?width=1758&name=embed-external-widgets-on-dashboard%20(1).png)
Embed External Widgets with Iframes
Enhance your dashboards by embedding external web pages and widgets using iframes in custom HTML widgets.
This allows you to combine insights from multiple platforms into a single interactive dashboard, accessible internally or via shareable links for external collaboration.
.png?width=1786&name=Customize-dashboard-layout%20(1).png)
Improved Dashboard Layout Customization
Easily adjust widget width and height to design beautifully aligned dashboards with large maps and timelines.
Share your customized dashboards via links or embed codes for internal or external collaboration.
Learn more about the art of building dashboards.
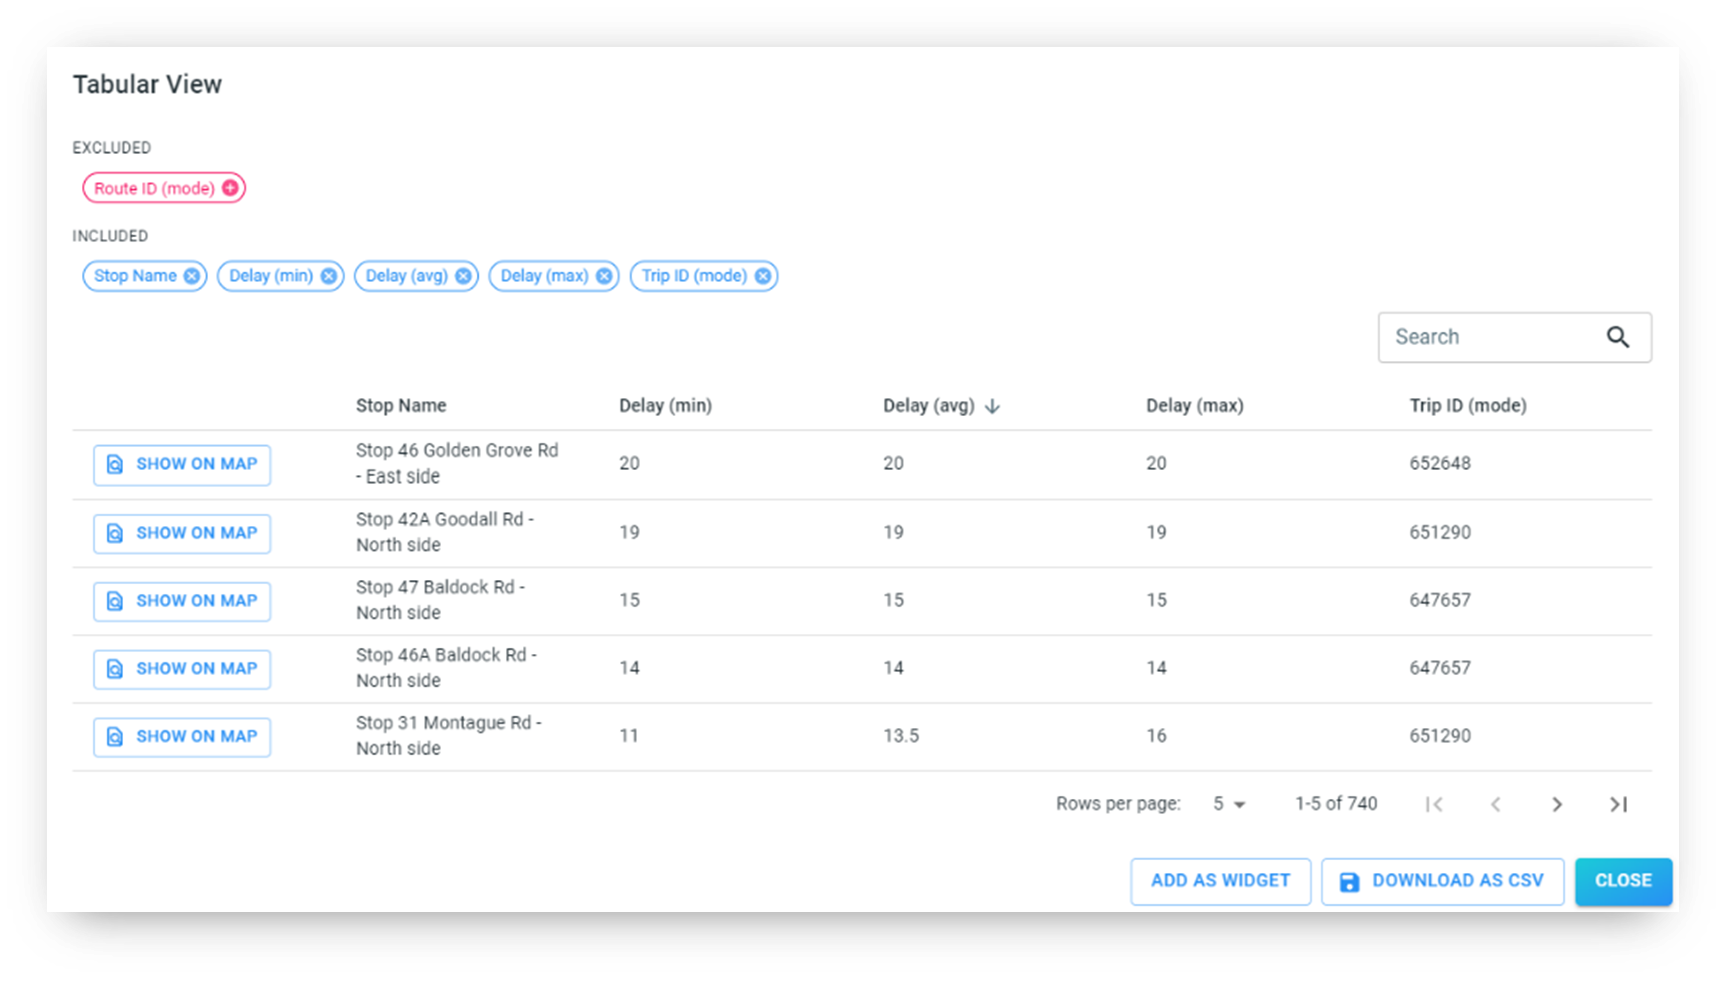
Create Top 10 Lists with Data Tables
Analyze your data in a tabular view with sorting capabilities to generate ranked lists.
Quickly identify key insights, such as the stops with the most delays in a public transit network or streets with the highest accident rates.

Streamline Complex Data Tasks with a Secure API
Leverage the OpenAPI-compliant xyzt.ai API to automate tasks like project creation, data uploads, queries, and visual dashboard generation. Easily integrate with your preferred programming language (e.g., Python, Java, Typescript) and simplify workflows with new tutorials demonstrating quick automation solutions.
A new tutorial shows how, with just a few lines of code, users can automate otherwise complex interactions and data queries.
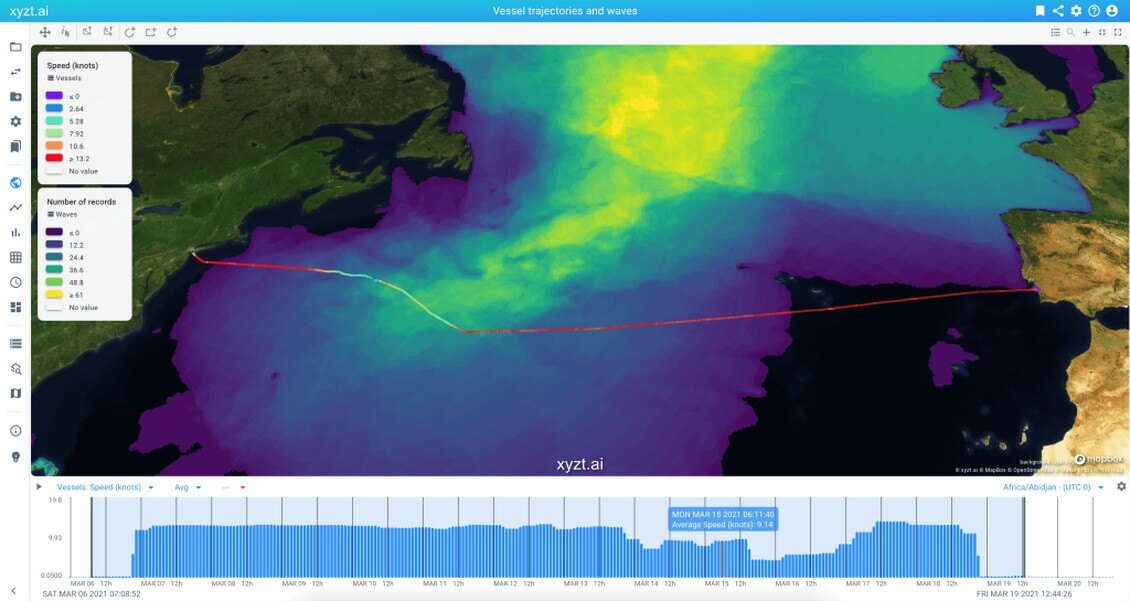
Multi-Source Analysis for Mobility and Maritime Intelligence
Combine and correlate diverse data sources like traffic density, floating vehicle waypoints, road incidents, telecom OD data, weather, ocean conditions, and vessel IoT data.
With xyzt.ai’s interactive multi-layered interface, mobility and maritime analysts can unify complex data into a single, insightful situational view.

Multi-Scale Trajectories for Movement Flow Analysis
Visualize movement data as dynamic trajectories with xyzt.ai’s multi-scale tiled data structure. Analyze patterns, filter by time or data properties, and replay animations smoothly—even for large datasets.
This feature enhances the analysis of complex flows, such as port vessel movements or urban truck routes.
World-Oriented Icons for Precision Incident Analysis
Display icons with real-world sizes, orientations, and adaptive scaling based on data attributes like heading, width, and length.
Ideal for maritime, aviation, and mobility analysts, this feature enables accurate visualization of vessel or vehicle positions, supporting digital twin applications and detailed movement insights.
Interested in learning more?
Schedule a live demo with one of our experts to explore how xyzt.ai can transform your organization's data analysis.