LOCATION DATA ANALYTICS

xyzt.traffic.insights™

A ready-to-use traffic insights dashboard to monitor and analyze road safety and efficiency for your municipality or city

Use cases for geospatial time series data

Smart city applications

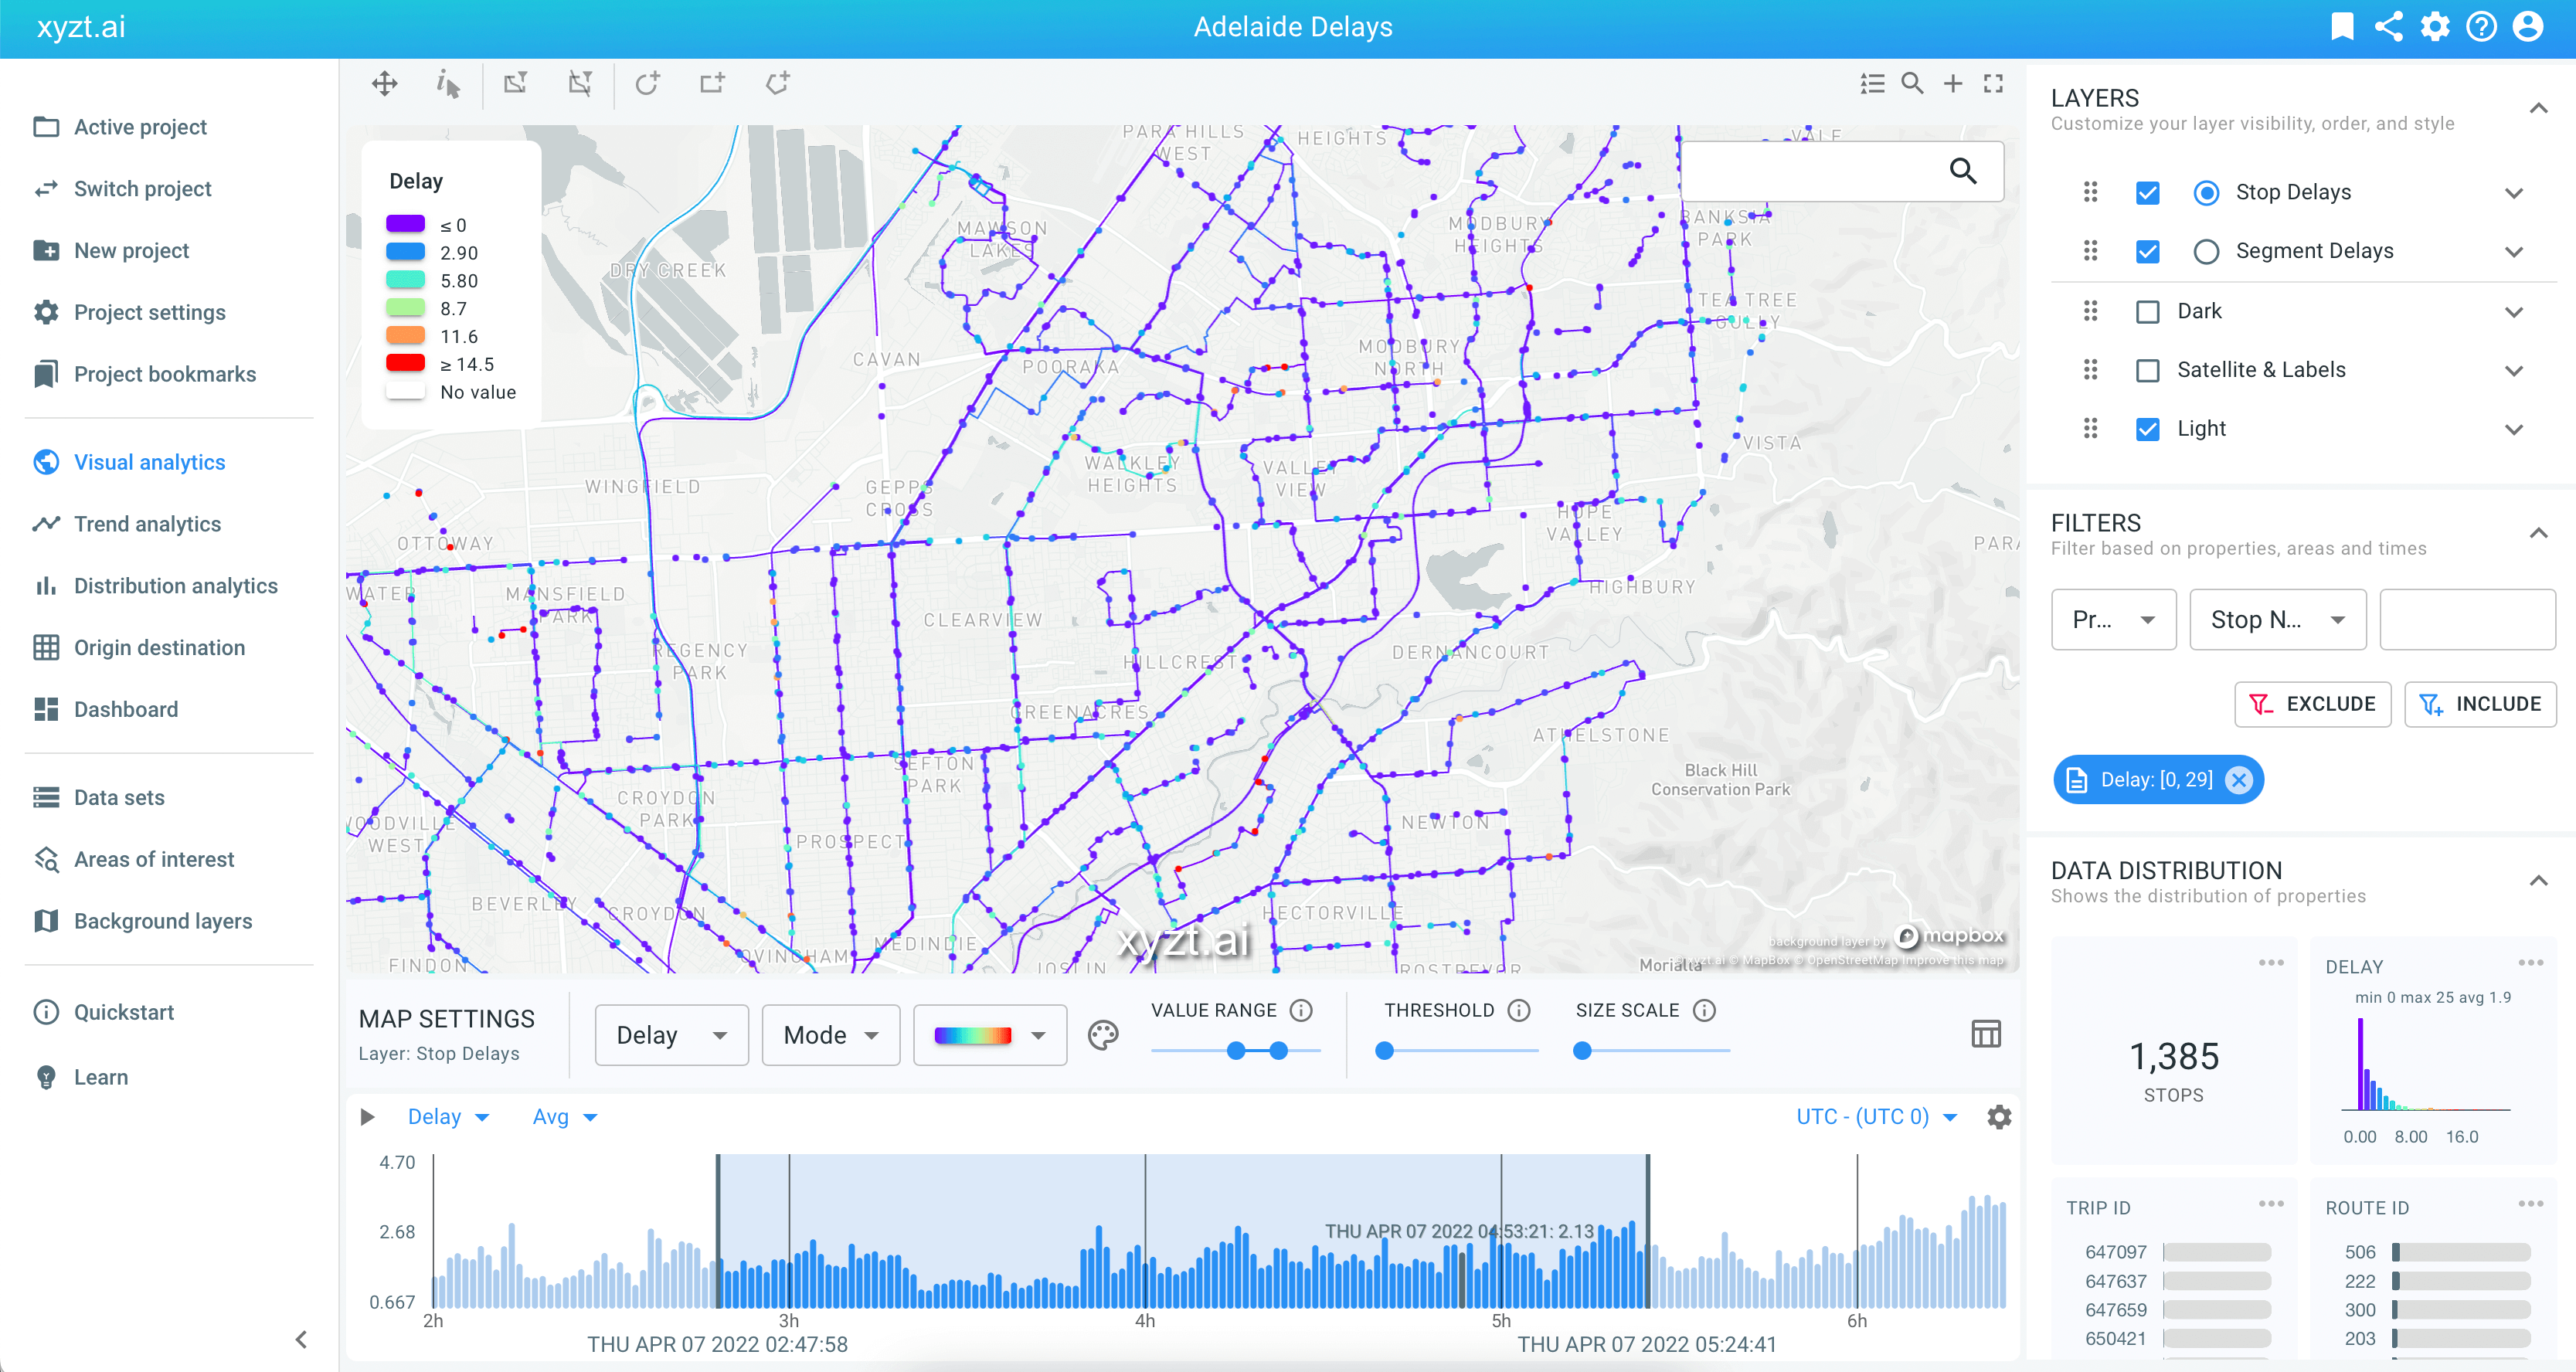
Mobility companies can leverage IoT devices for smart city applications with camera feeds, air quality and noise pollution sensors, or privacy-preserving crowdsensing sensors to count and measure the effect of pedestrians, bicycles, and other traffic over time.

timeseries_public_transport2_xyzt-1

Port congestion analysis

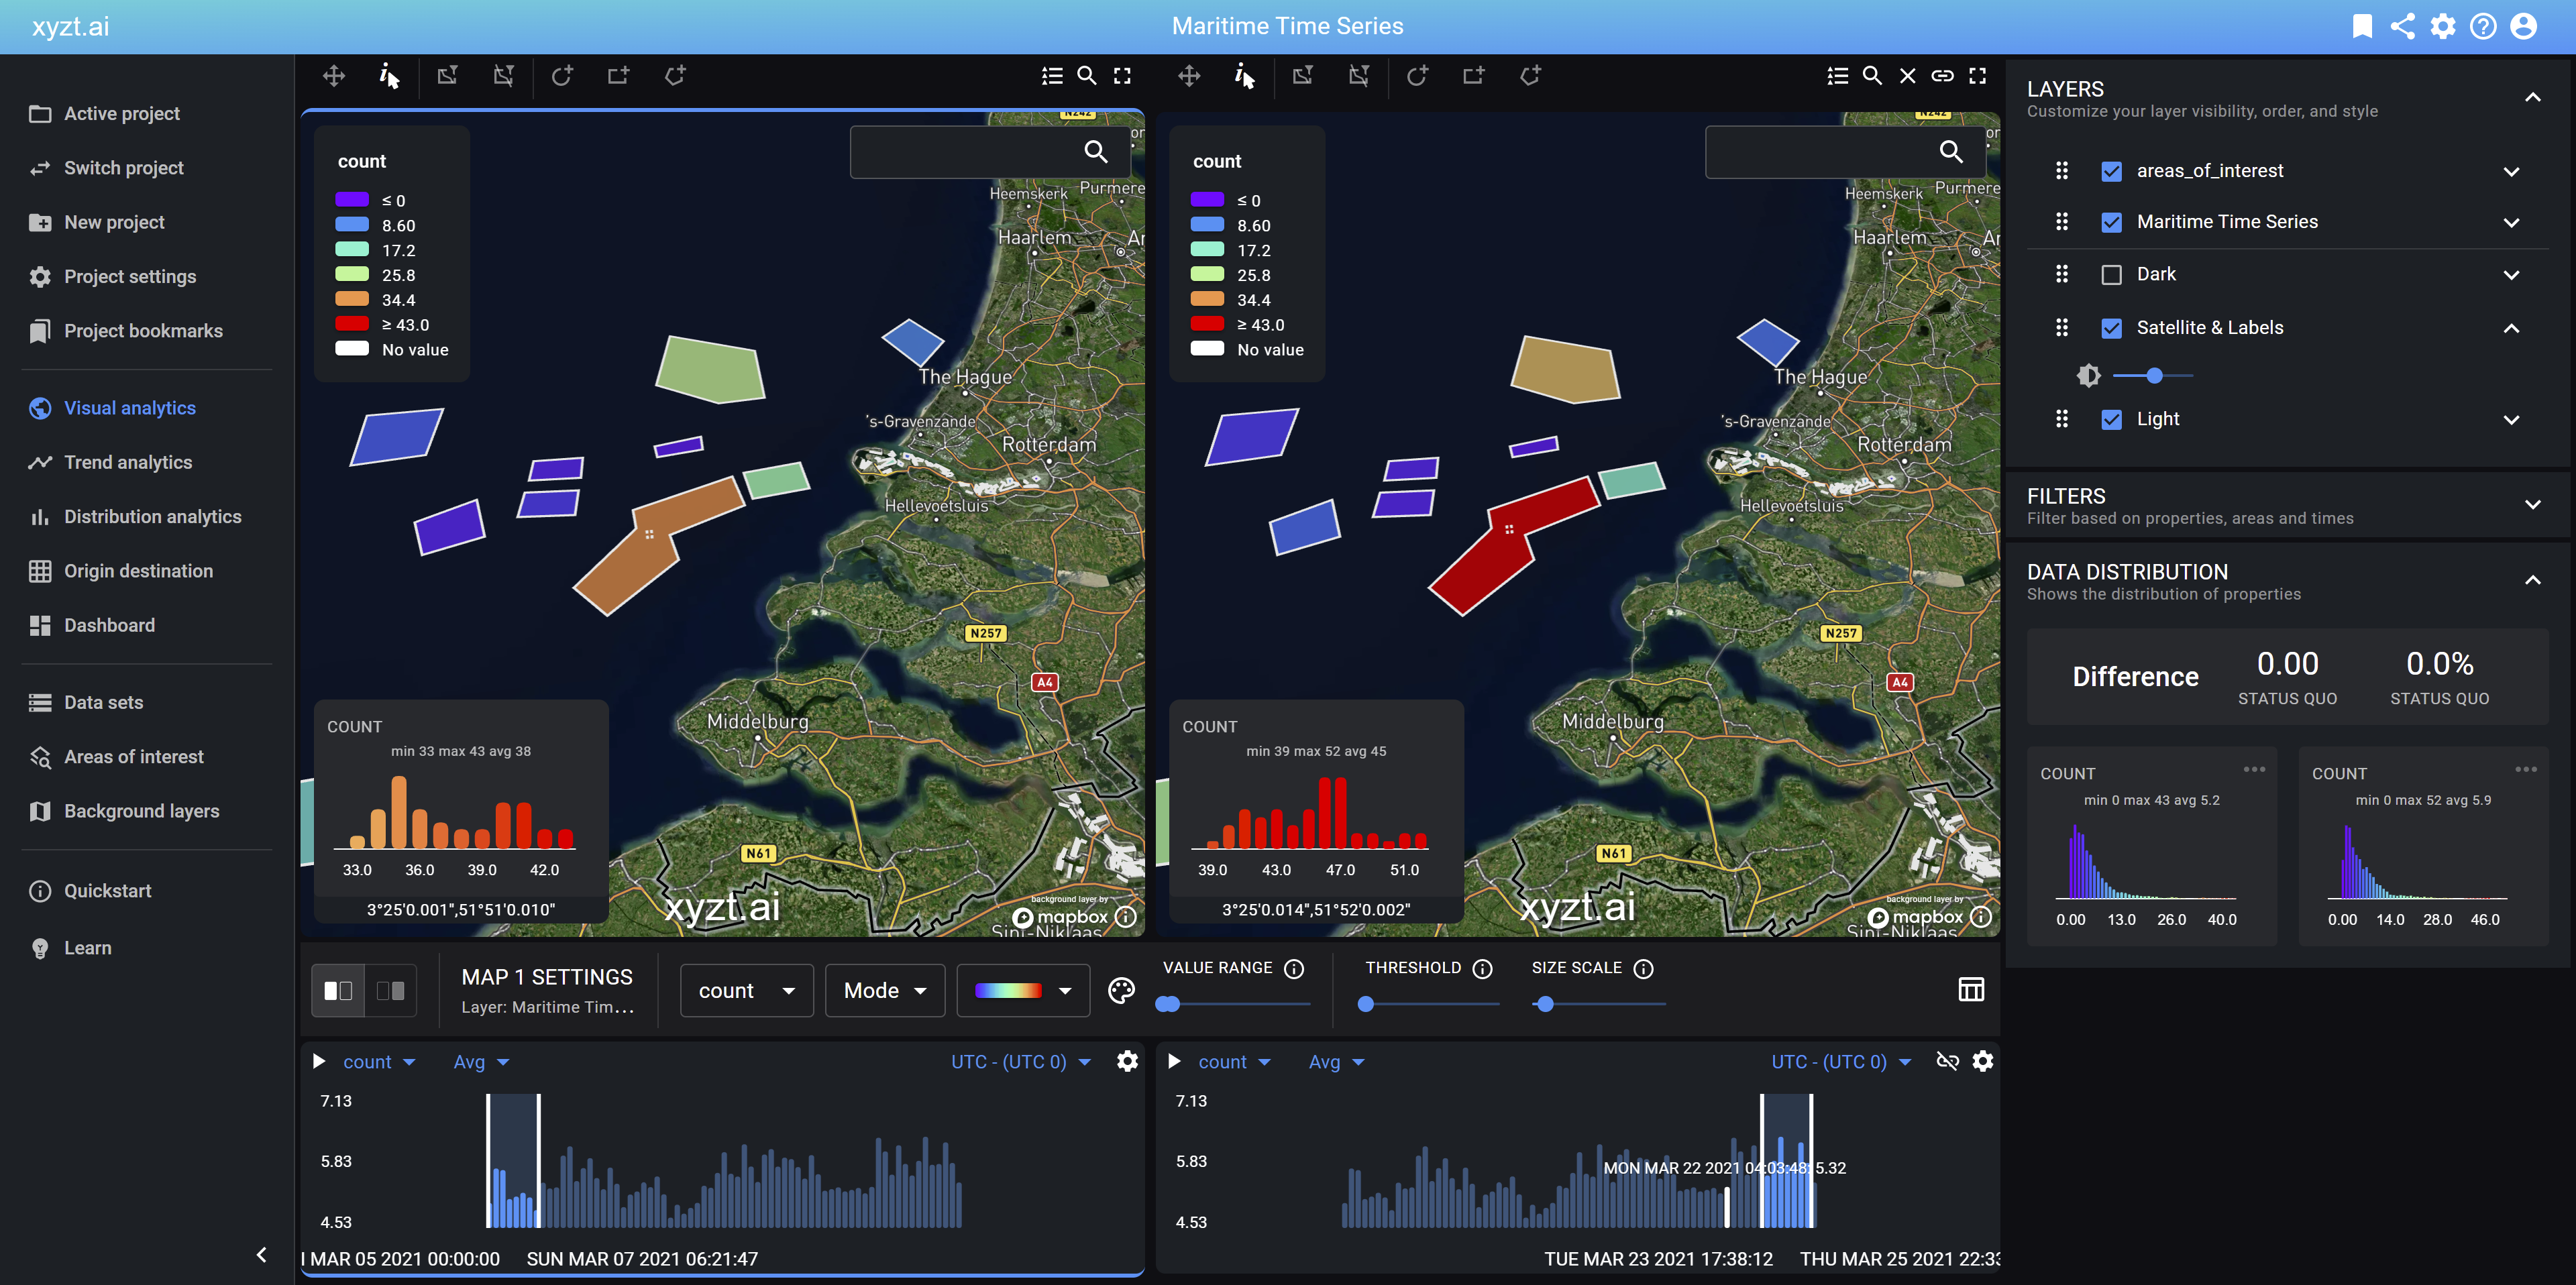
Port authorities keep track of different anchorage zones or terminals to identify how many vessels are present at any given time and how long they stay there. By visualizing and analyzing this information over time, port authorities gain deep insights into the level of congestion and how to improve for a more efficient future policy.

Monitoring anchorage zones for maritime time series data analysis

Crowd monitoring for safety

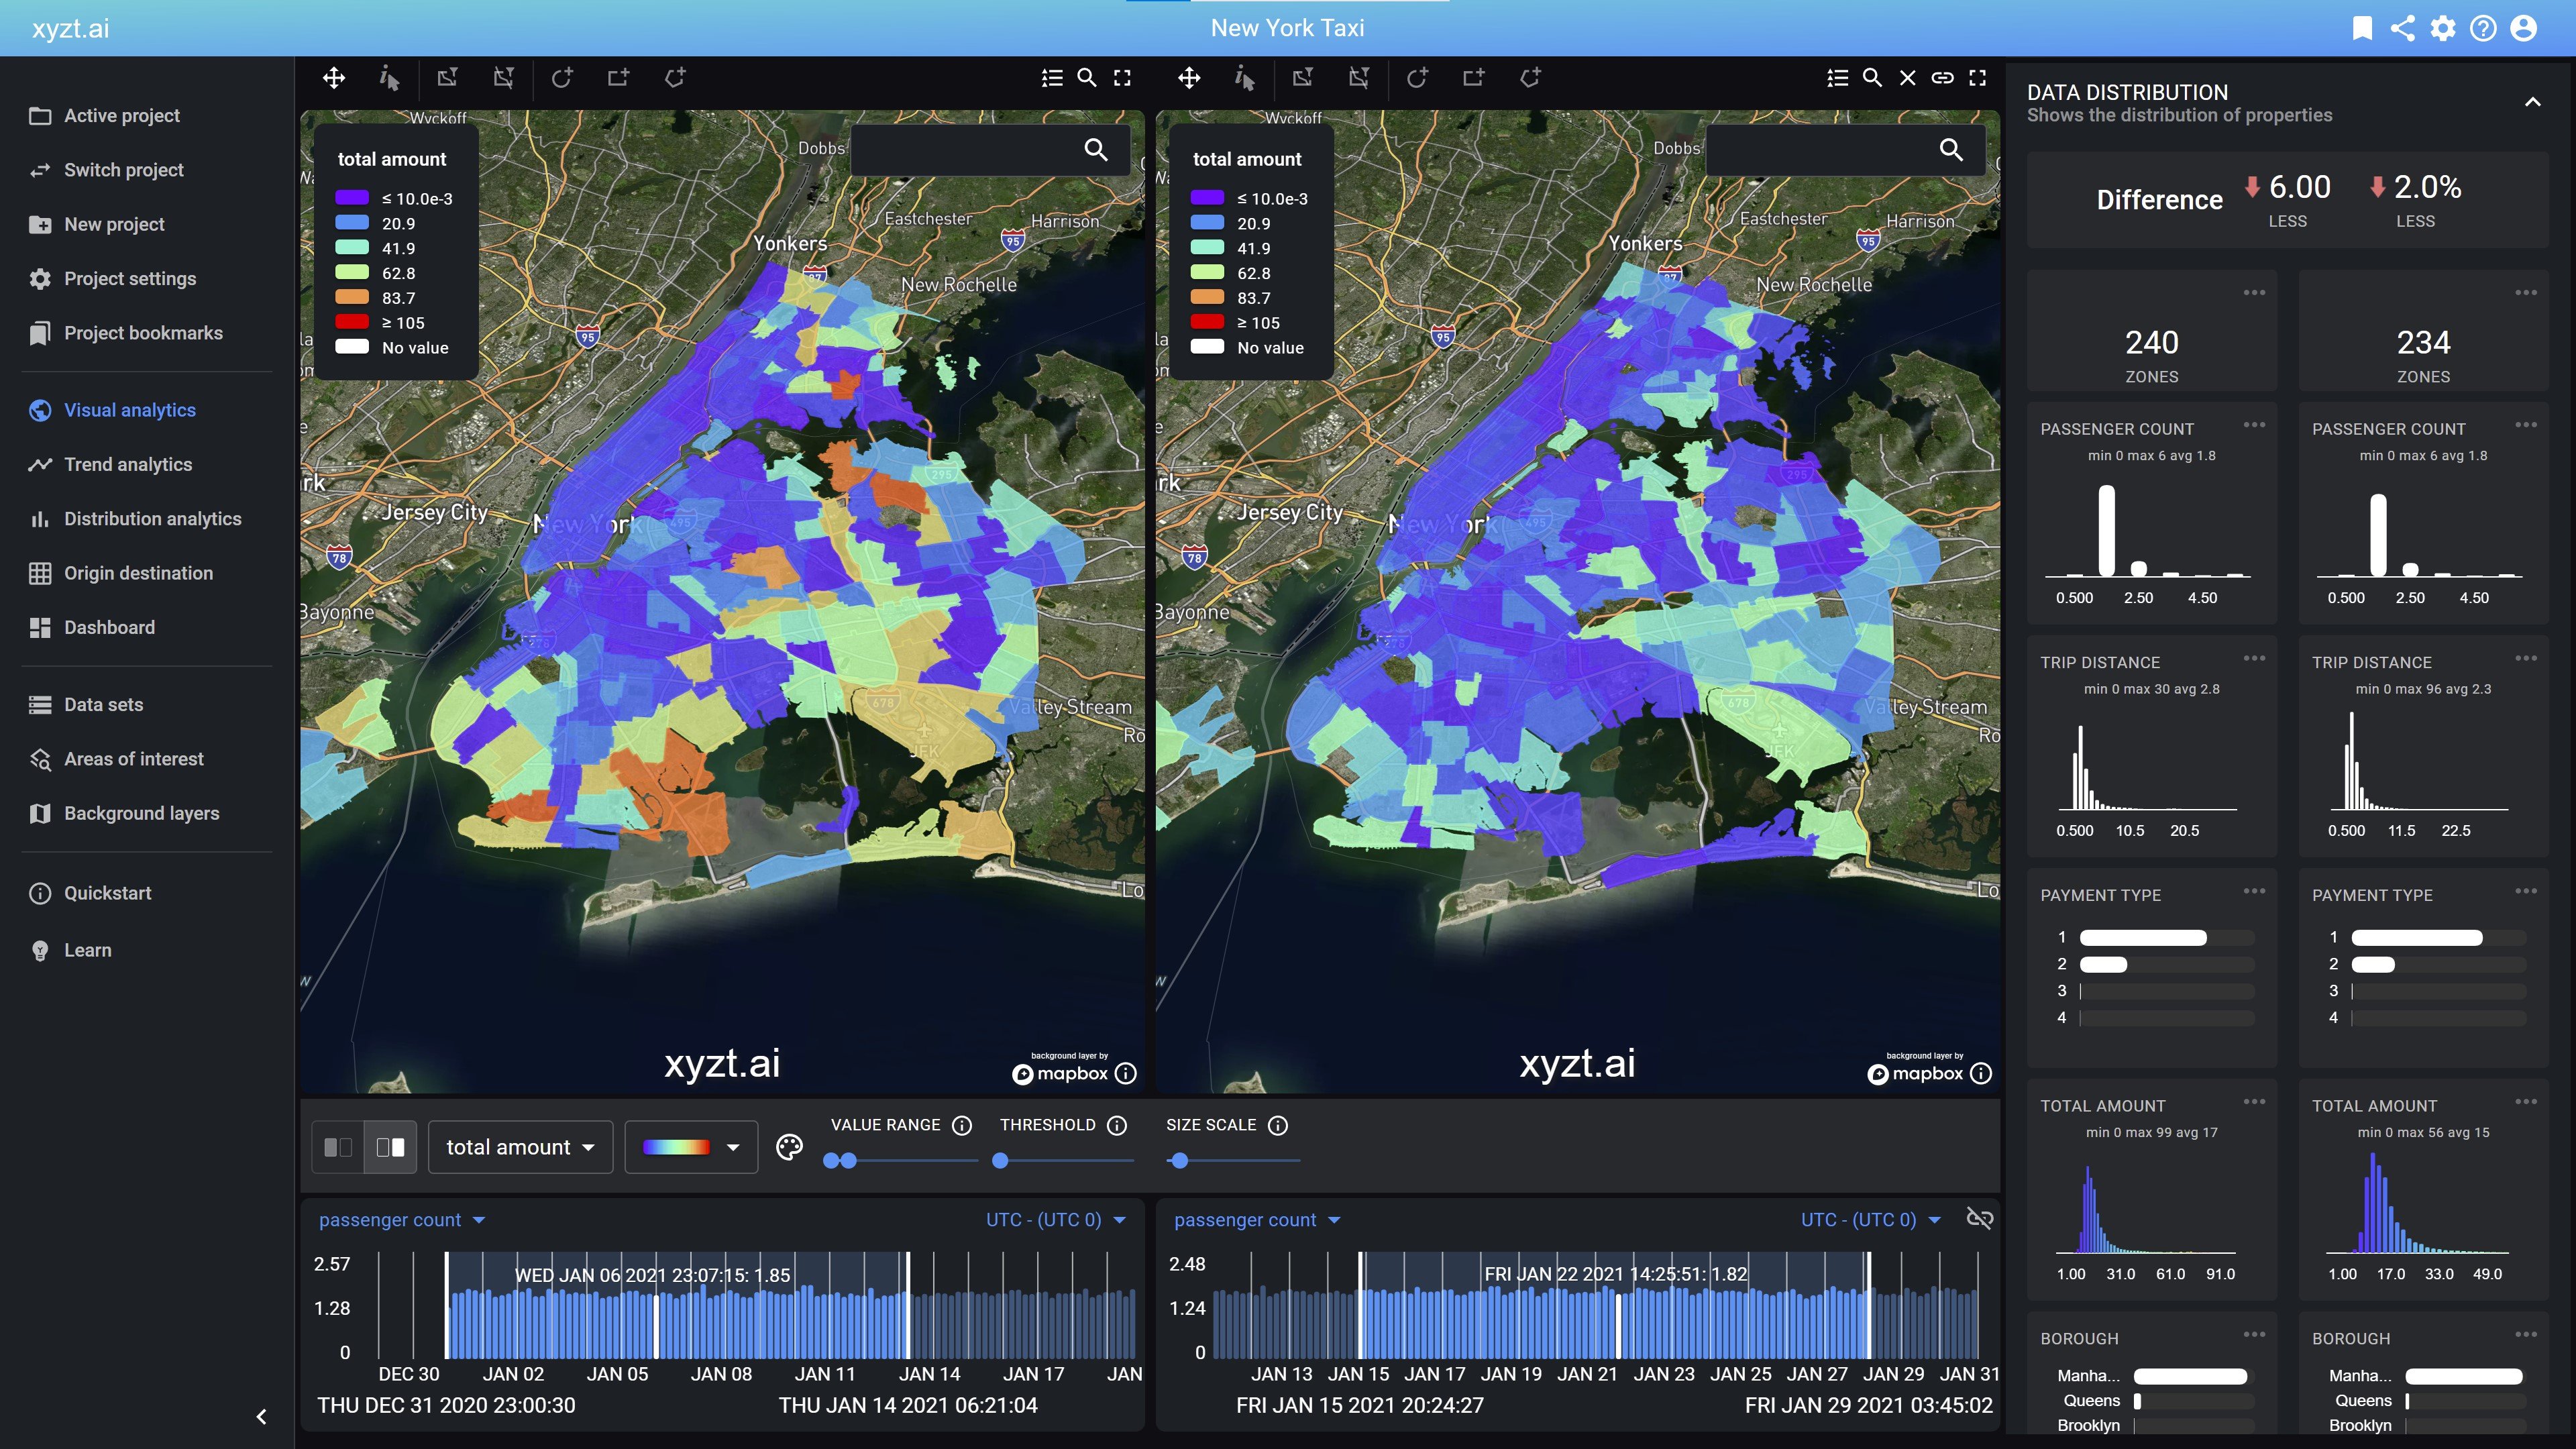
Privacy-preserving crowdsensing sensors enable companies and city authorities to increase safety and security by visualizing and monitoring people flow in real-time or by analyzing historic time series data to learn from passenger flows and to avoid overcrowding.

Real time series data for crowd monitoring
TESTIMONIAL CROWDSCAN

“Working with xyzt.ai is such a win-win. We capture real-time series data with our sensors and by using the xyzt.ai analytics tool, we can make the data intuitive for our customers to understand. We can spatially visualize the data, learn about the different segmentations, and we can create data dashboards to combine it with our own. This combination of having a go-to tool that we can use internally as well as externally to show our data to customers is very important for us.”

CrowdScan headshot Ben Bellekens
Ben Bellekens
CEO & Co-Founder, CrowdScan

The possibilities for geospatial time series data analysis

timeseriesdata-1

Big data, new opportunities

The amount of geospatial time series data is exploding as a result of the
rapid increase in the use of Internet-of-Things devices and sensors for the mobility, maritime, and people flow industry.

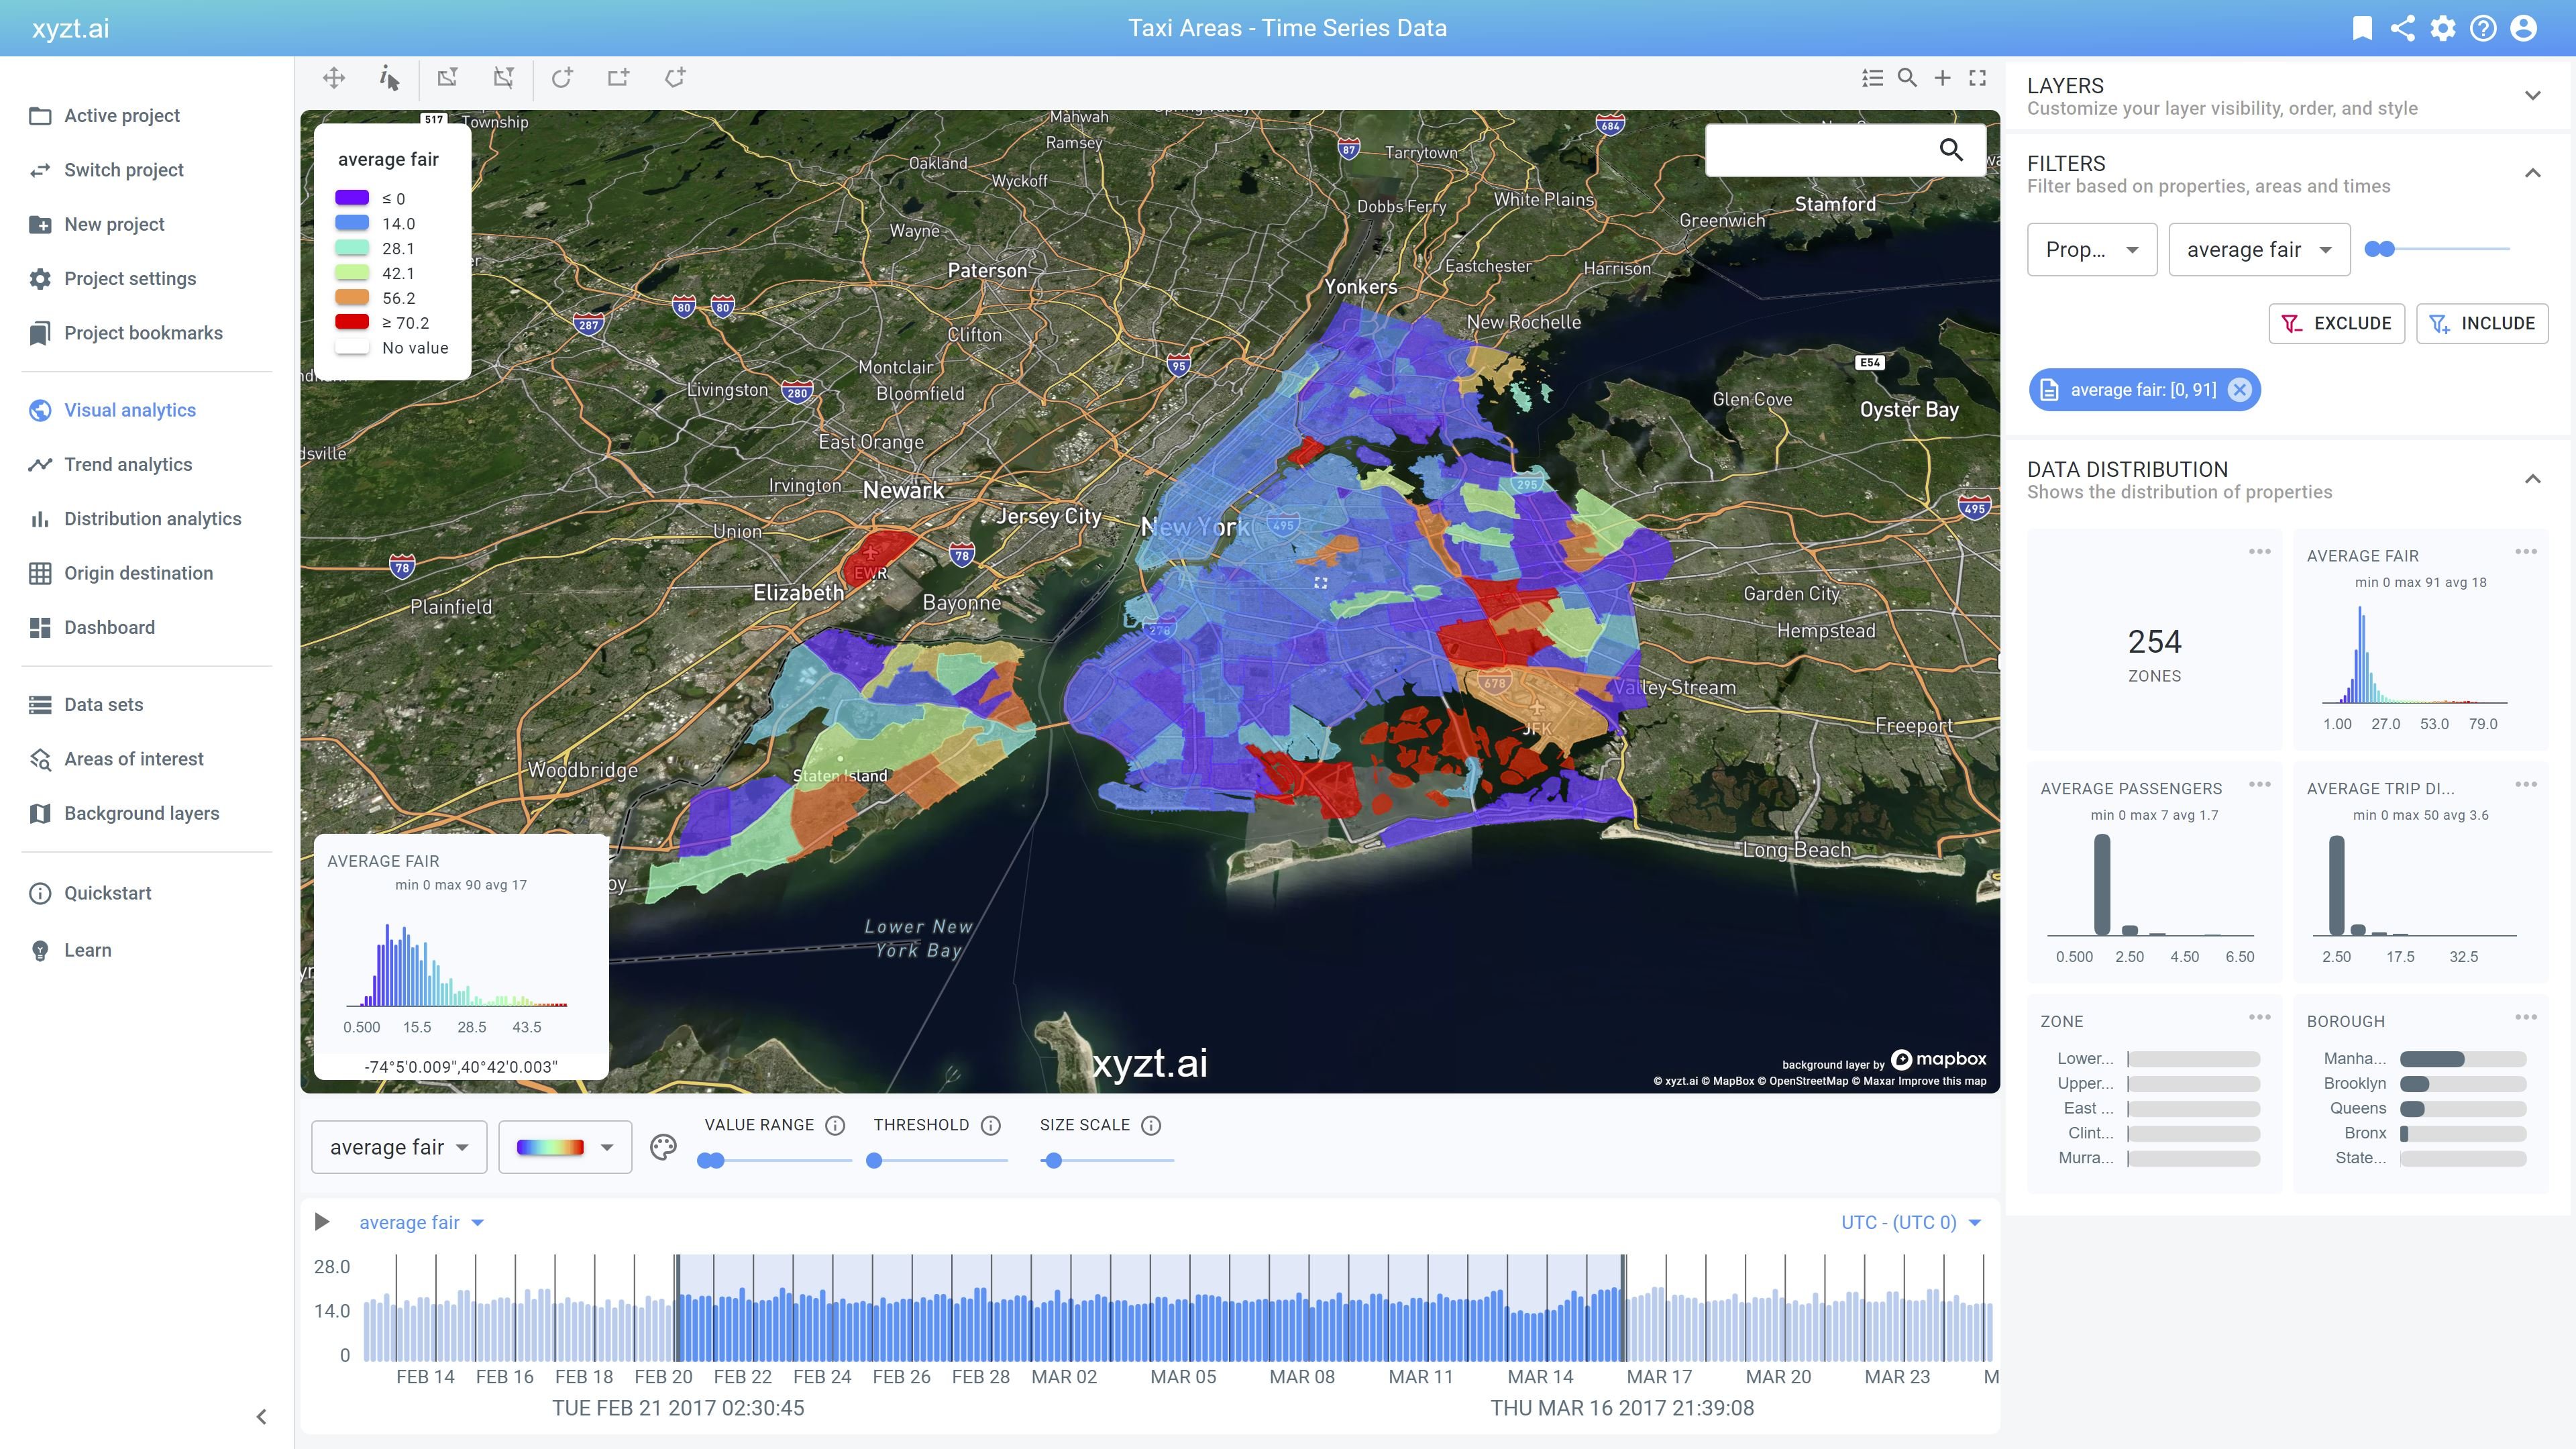
By visualizing and analyzing the massive amounts of geospatial time series data with a powerful analytics tool, companies and agencies can translate sensor data into business intelligence and new opportunities.

There are countless possible use cases in which time series data analysis leads to actionable information. Some can be quite general, others are very specific and context-dependent.

Do you have one in mind? Let us know!

FREE TRIAL

The best way to learn is by trying

See for yourself how time series data can easily be visually analyzed at scale. Sign up for our free trial and explore time series data today.
No credit card required.

Psst... here is a tutorial that will help you find your way!

What is geospatial time series data exactly

Geospatial time series data is data that changes over time, but that is captured at a fixed location. This means the source is static, while the information the sensor or device is capturing, is dynamic.

For example, a noise pollution sensor capturing the volume of sound in a busy street. The sound frequencies vary, but the location of the sensor remains the same.

Why is geospatial time series data important

Digital transformation and the trend of connectivity across the mobility, maritime, and people flow industries are accelerating the use of various connected devices, such as cameras, microphones, and a lot more smart sensors.

These smart sensors generate billions of geospatial time series data on a daily basis and stimulate the development of intelligent systems that make our world smarter and more sustainable.

taxi fares time series data

How to benefit from geospatial time series data

To extract innovative insights out of your geospatial time series data, your analytical tool should:

  • Scale and visualize billions of geospatial time series data

  • Be easy to use so you don’t create unnecessary bottlenecks within your company

  • Allow you to bring your own data and combine other data sets, such as movement data.

  • Provide you with advanced interactivity to step beyond visualization and dig in the data.

  • Enable you to create dashboards and analytical reports to share your insights with colleagues or external parties.

Context is a crucial element in any data analysis. Therefore, the capability to add and combine different data sets from different sources is an instrumental, and often undervalued, tool for any modern data analyst.

For example, the combination of geospatial time series data with movement data creates interesting insights and opportunities.

By combining floating car data (movement data) with noise pollution data (time series data) city authorities and mobility companies are able to gain a deeper understanding of what mobility means today and the effect it has on its environment to create a better tomorrow.

TUTORIAL

Follow a simple use case

Embark on a thought experiment with me and discover how time series data analysis works so you can do it yourself.

BOOK A MEETING

Discover the potential of time series data

Have a chat with Nick and learn how time series data analysis helps you understand your world better.

Choose your own time and day.

Nick for Time Series Data

Explore time series data today

See for yourself how easily time series data can be visualized and analyzed for unique insights

Sign up for the free trial today and start your journey
No obligations. No credit card